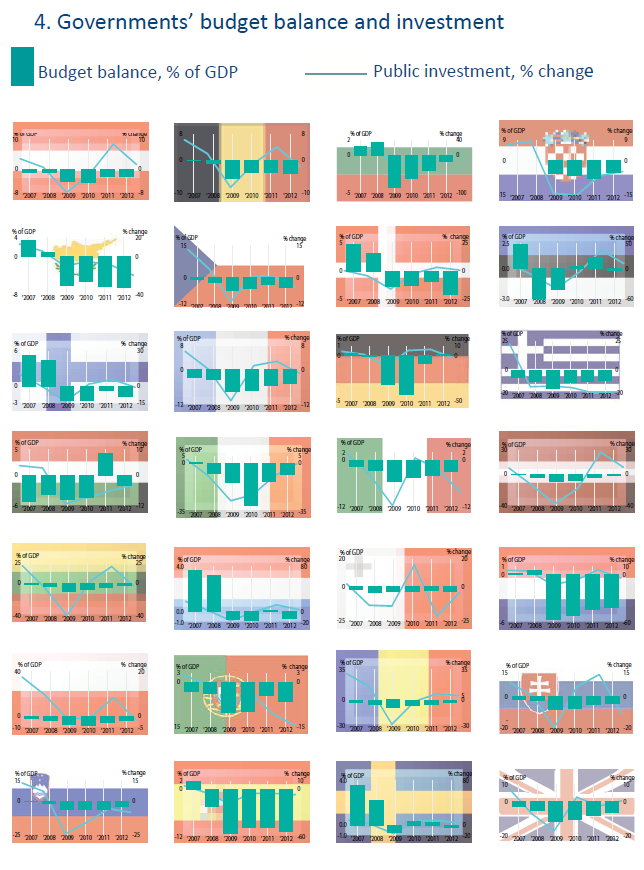
The small charts
show for each
MS how the government
budget
balance – on the
left, in % GDP –
changed over the
years along with
expenditure on
investment – on
the right handaxis
– in % change
over the previous
year.

 / March 3, 2014
The small charts
show for each
MS how the government
budget
balance – on the
left, in % GDP –
changed over the
years along with
expenditure on
investment – on
the right handaxis
– in % change
over the previous
year.






Be the first to write a comment.