

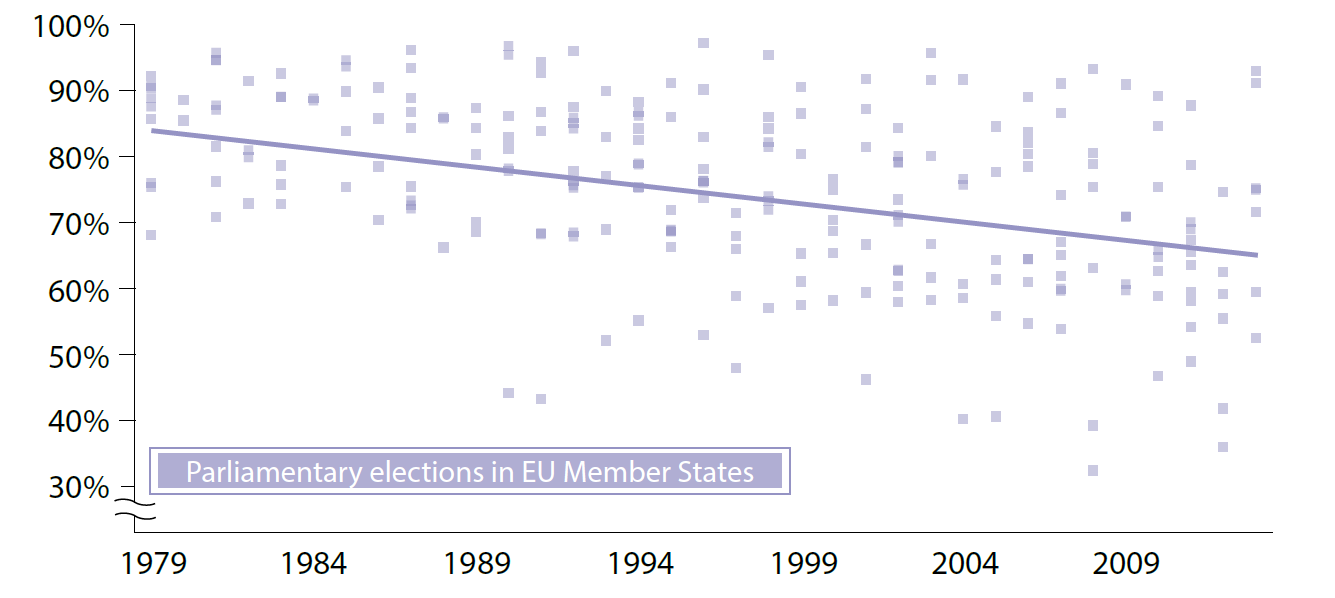
The graph shows the wide variation in turnout in parliamentary elections among EU Member States. Each dot
represents the turnout in an individual national parliamentary election in one of the EU-28 Member States (for those
which joined the EU in 2004 or later, only elections from 1990 on are considered).






Be the first to write a comment.