

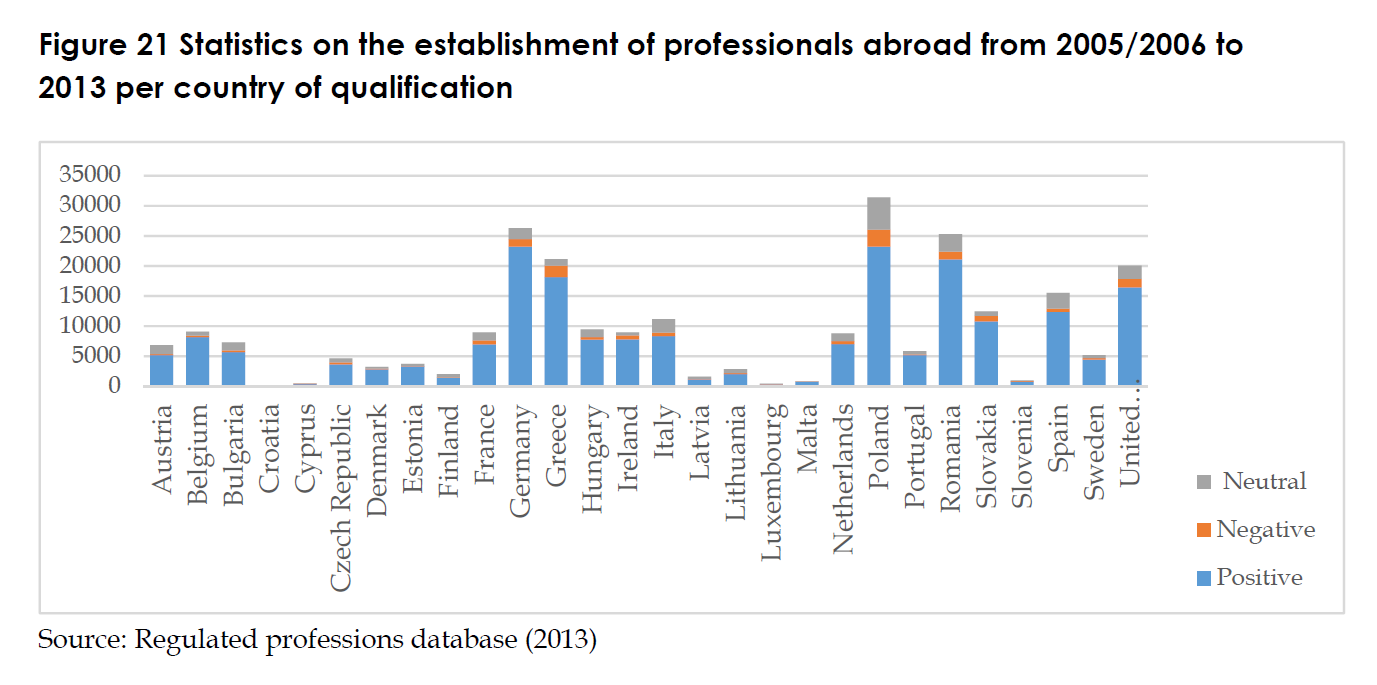
Figure 21 shows all the requests of professional establishment
received by another member state between 2006 and 2013 per country of qualification.
These data cover all professions. On average, more than half of the requests were
accepted but for few countries for which the relative percentage of negative requests is
slightly higher (i.e. Poland and Greece).






Be the first to write a comment.