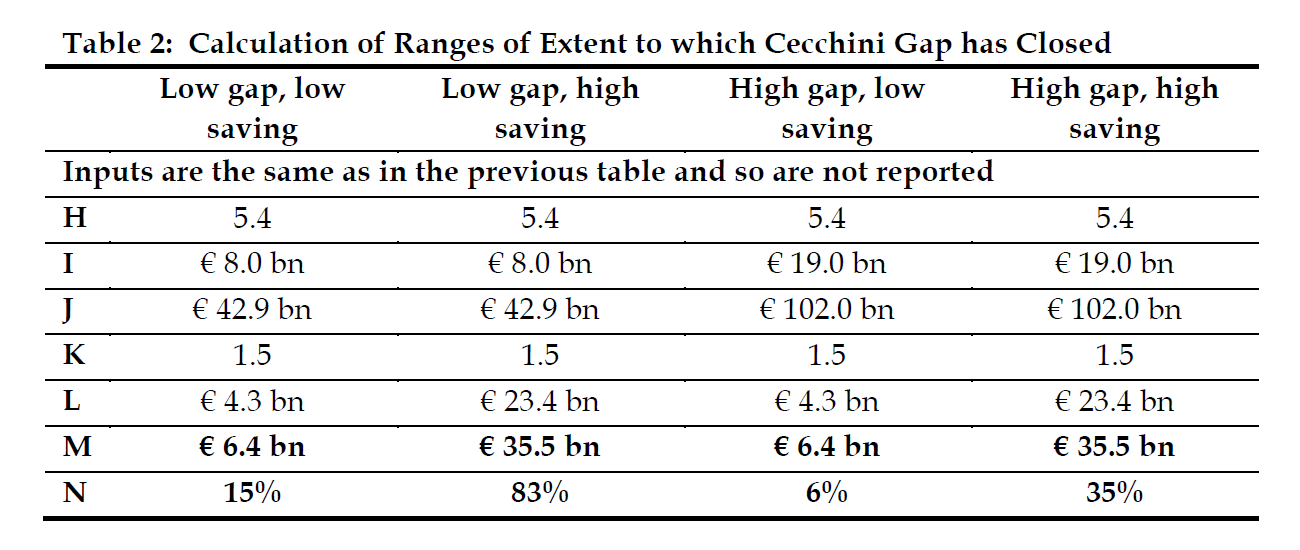
As both the original Cecchini study and the 2006 report gave ranges, Table 2 shows the remaining gap on the basis of combinations of the high and low estimates produced by
each study.

 / October 2, 2014
As both the original Cecchini study and the 2006 report gave ranges, Table 2 shows the remaining gap on the basis of combinations of the high and low estimates produced by
each study.






Be the first to write a comment.