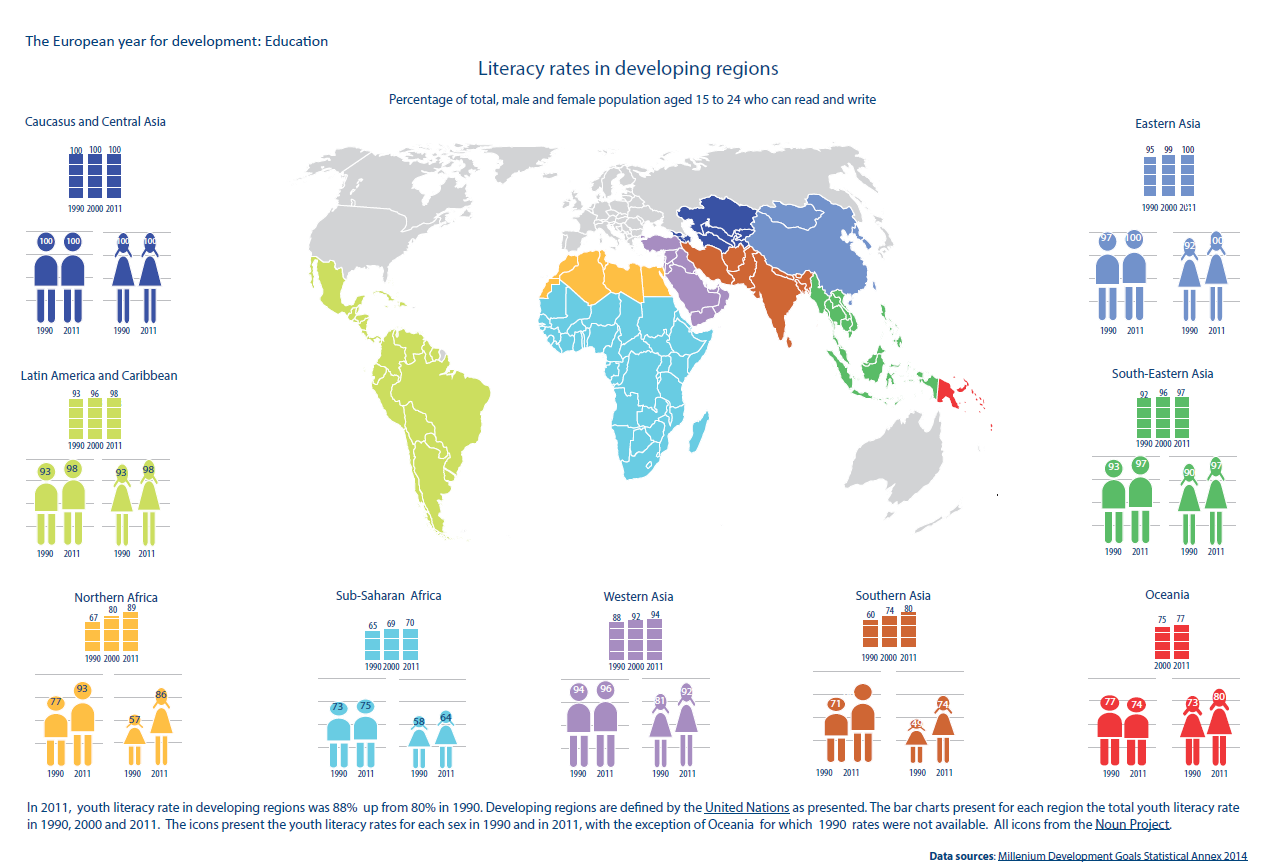
In 2011, youth literacy rate in developing regions was 88% up from 80% in 1990. Developing regions are defined by United Nations as presented. The bar charts present for each region the total youth literacy rate in 1990, 2000 and 2011. The icons present the youth literacy rates for each sex in 1990 and 2011, with the exception of Oceania for which 1990 rates were not available. All icons from the Noun Project.
Literacy rates in developing regions
Categories:
Related Articles
Visit the European Parliament page on
We write about
RSS Link to Scientific Foresight (STOA)
RSS Link to Members’ Research Service
Blogroll
Disclaimer and Copyright statement
The content of all documents (and articles) contained in this blog is the sole responsibility of the author and any opinions expressed therein do not necessarily represent the official position of the European Parliament. It is addressed to the Members and staff of the EP for their parliamentary work. Reproduction and translation for non-commercial purposes are authorised, provided the source is acknowledged and the European Parliament is given prior notice and sent a copy.
For a comprehensive description of our cookie and data protection policies, please visit Terms and Conditions page.
Copyright © European Union, 2014-2019. All rights reserved.
Be the first to write a comment.