
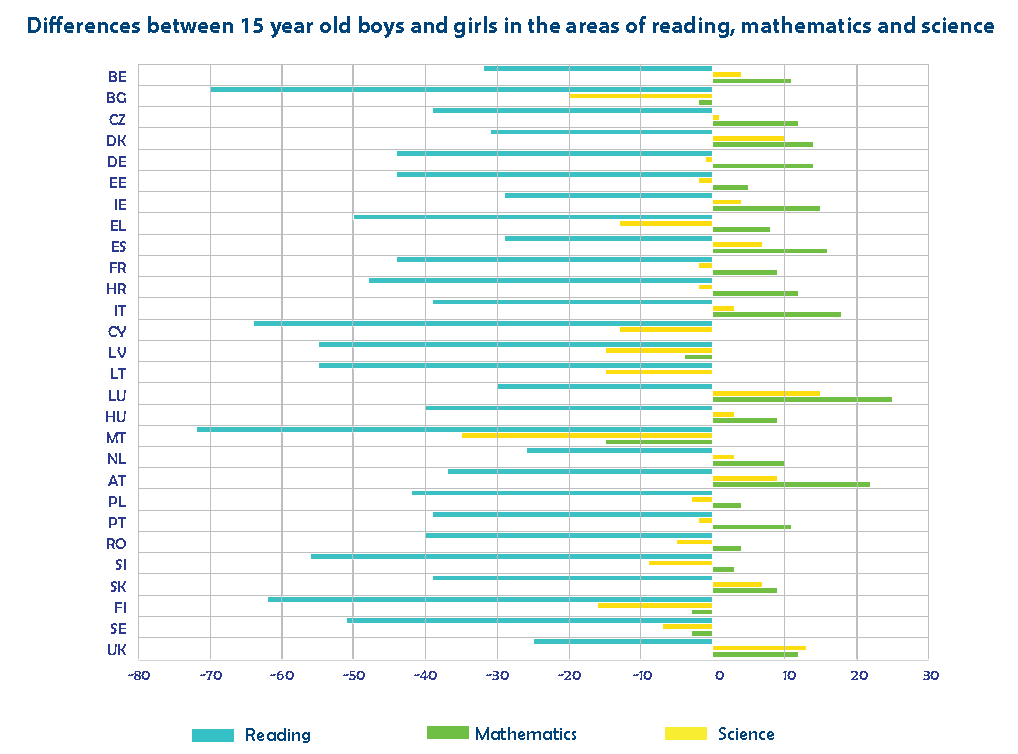
The graph shows differences in points between the mean scores of boys and girls in the tests under the OECD’s Programme for International Student Assessment (PISA) in mathematics, science and reading. Negative values (to the left of zero) show differences favouring girls and positive values (to the right) favouring boys. All results are for PISA 2012 except Malta (2009). As the results are based on samples of the population concerned, some of the smaller differences should not be regarded as statistically significant.

Differences between 15 year old boys and girls in the areas of reading, mathematics and science
Visit the European Parliament page on
We write about
RSS Link to Scientific Foresight (STOA)
RSS Link to Members’ Research Service
Blogroll
Disclaimer and Copyright statement
The content of all documents (and articles) contained in this blog is the sole responsibility of the author and any opinions expressed therein do not necessarily represent the official position of the European Parliament. It is addressed to the Members and staff of the EP for their parliamentary work. Reproduction and translation for non-commercial purposes are authorised, provided the source is acknowledged and the European Parliament is given prior notice and sent a copy.
For a comprehensive description of our cookie and data protection policies, please visit Terms and Conditions page.
Copyright © European Union, 2014-2019. All rights reserved.


Be the first to write a comment.



