

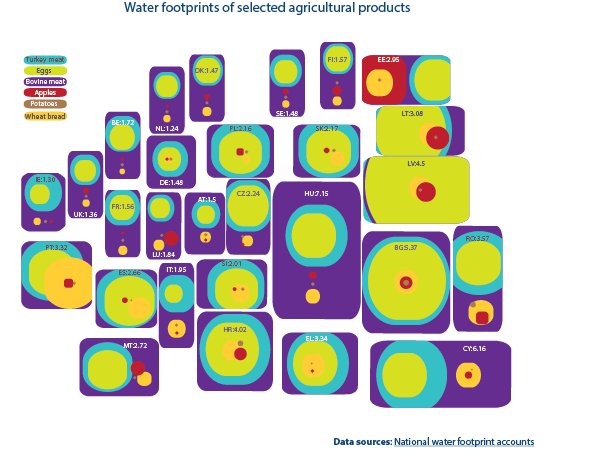
The chart compares the relative water footprints of a selection of agricultural products. The size of the country boxes is proportional to the selection’s average water footprint, which is specified in km3 per tonne, for each country.
All figures are from Mekonnen, M.M. and Hoekstra, A.Y. (2011) National water footprint accounts: The green, blue and grey water footprint of production and consumption, Value of Water Research Report Series No. 50, UNESCO-IHE, Delft, the Netherlands.






Be the first to write a comment.