

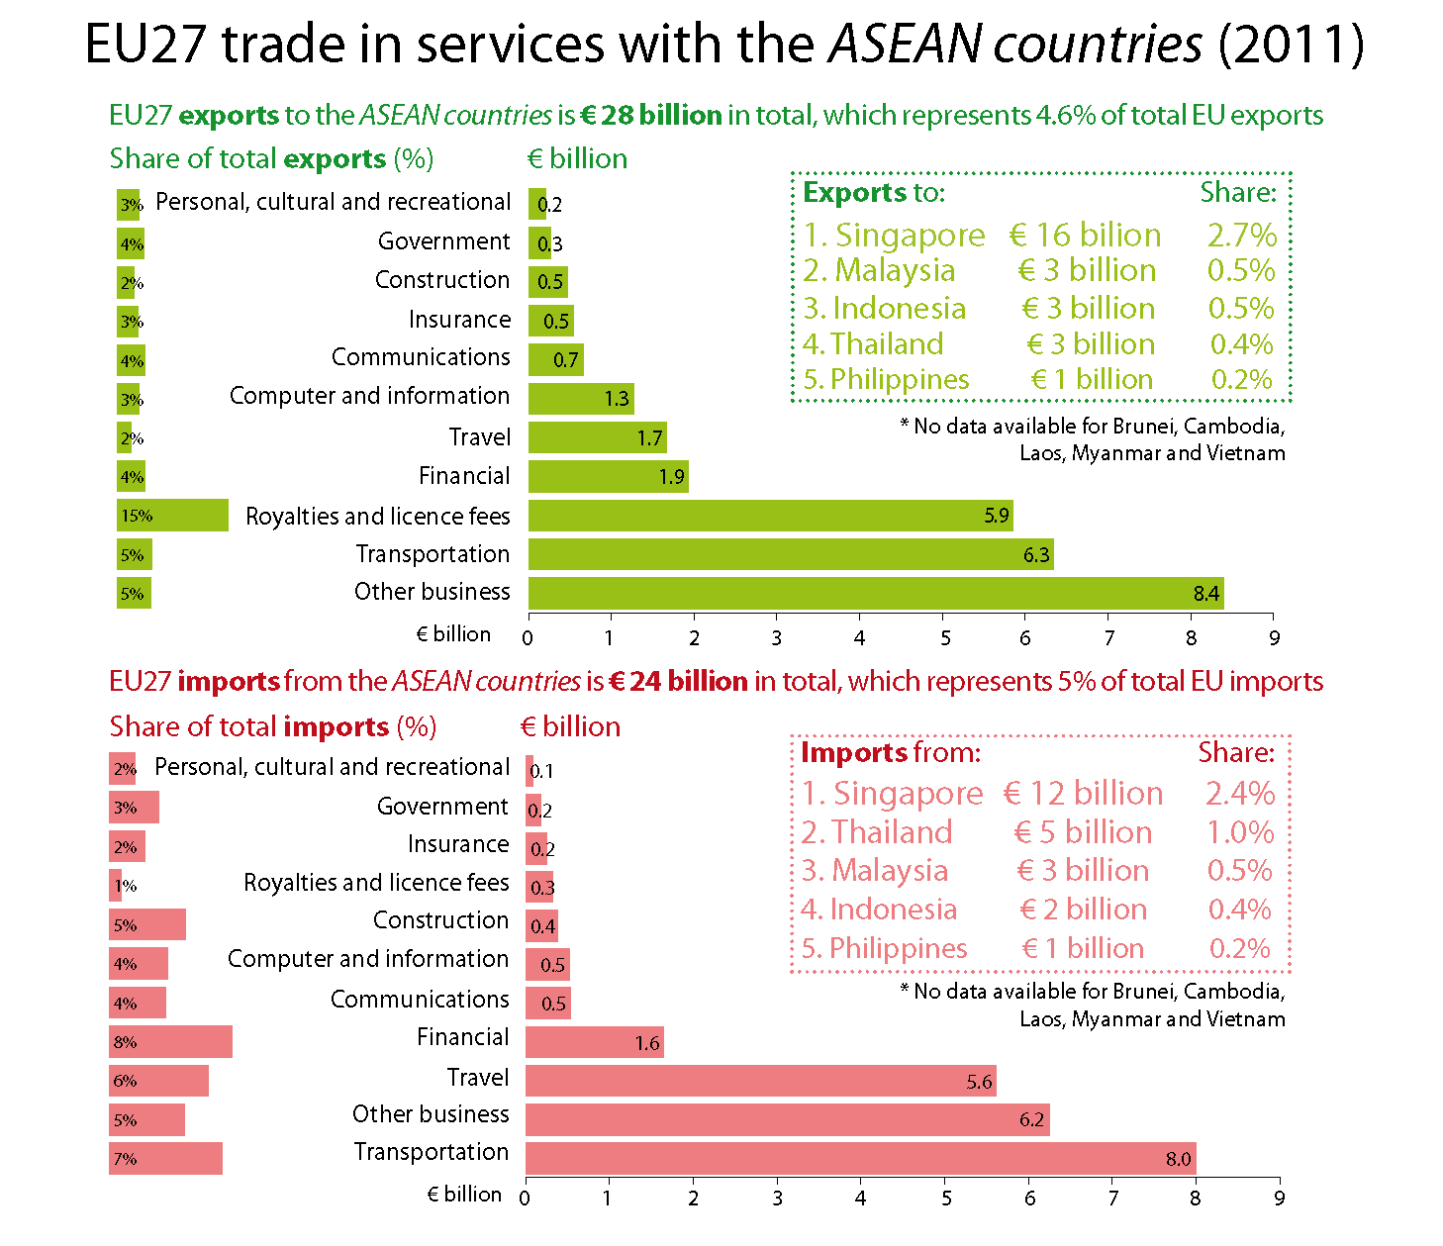
The graphics represent EU exports (in green) and imports (in red) of services to/from the ASEAN countries by type of service. The first bar chart (on the left) shows the percentage of total EU exports/imports represented by each type of service exported/imported to/from the ASEAN countries. The second bar chart shows in billion euros the services exported/imported to/from the ASEAN countries. The box gives the overall value of EU exports/imports to/from each of the ASEAN countries in billion euros and as a share of the EU’s exports/imports of services.
In practice, the EU exports “Transportation services” worth about €6.3 billion to the ASEAN countries; this represents 5% of all EU exports of “Transportation services”.
At country level, the EU exports €16 billion of services to Singapore, and this represents 2.7% of total EU exports of services.
The share has been calculated based on extra-EU trade, i.e. excluding trade between Member States.






Be the first to write a comment.