

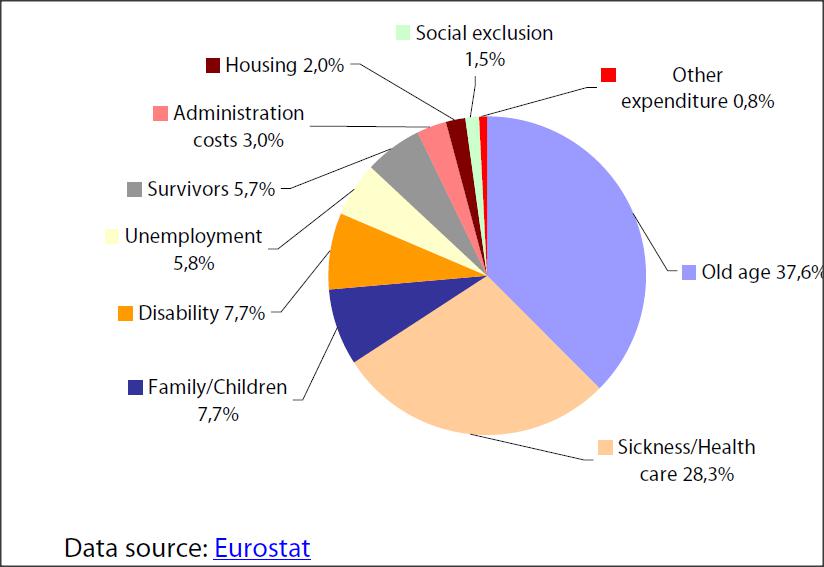
From a statistical point of view benefits are classified under eight headings in the European “System of integrated Social Protection Statistics” (ESSPROS) used by Eurostat.
Expenditures on social protection as a ratio of GDP accounted in 2009 for 29.5 % of EU 27 GDP, varying from a 16.9% to a 33.4% share at national level.
Expenditure on social protection per capita also show variations among EU MS. Assessed through “purchasing power standard” (which limits distortions resulting from price levels), expenditure per person varies by a factor of more than 6. The relative shares of benefit spending are presented in the figure.






Be the first to write a comment.