
According to the EU legislation, statistics on waste should cover all economic activities. The waste regulation doesn’t prescribe a specific data collection method and as a result, the way waste is allocated to generating sectors depends on the data collection method applied by the country.
On this page, total waste is compared with the plastic waste generated by the different economic activities across MS as well as for the EU as a whole.
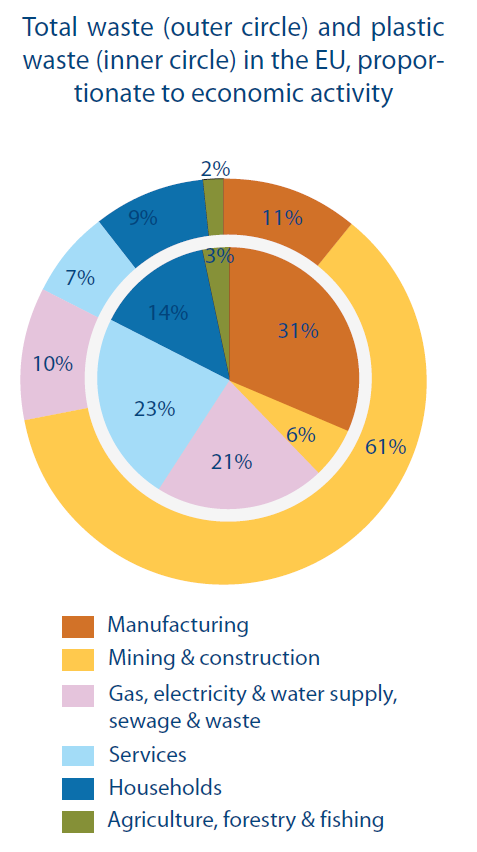
Several economic sectors, as established in the Statistical Classification of Economic Activities are grouped under four main headings in the Member States chart. In the figure charting EU distribution, the category ‘Other’ is split into two groups: first ‘Electricity, gas, (including steam and air conditioning supply) and water supply; sewerage, waste management and remediation activities’, and a second, ‘Mining and construction activities’. Furthermore ‘Households’ data are shown separately from those of the ‘Agriculture, forestry and fishing sector’.


Be the first to write a comment.