

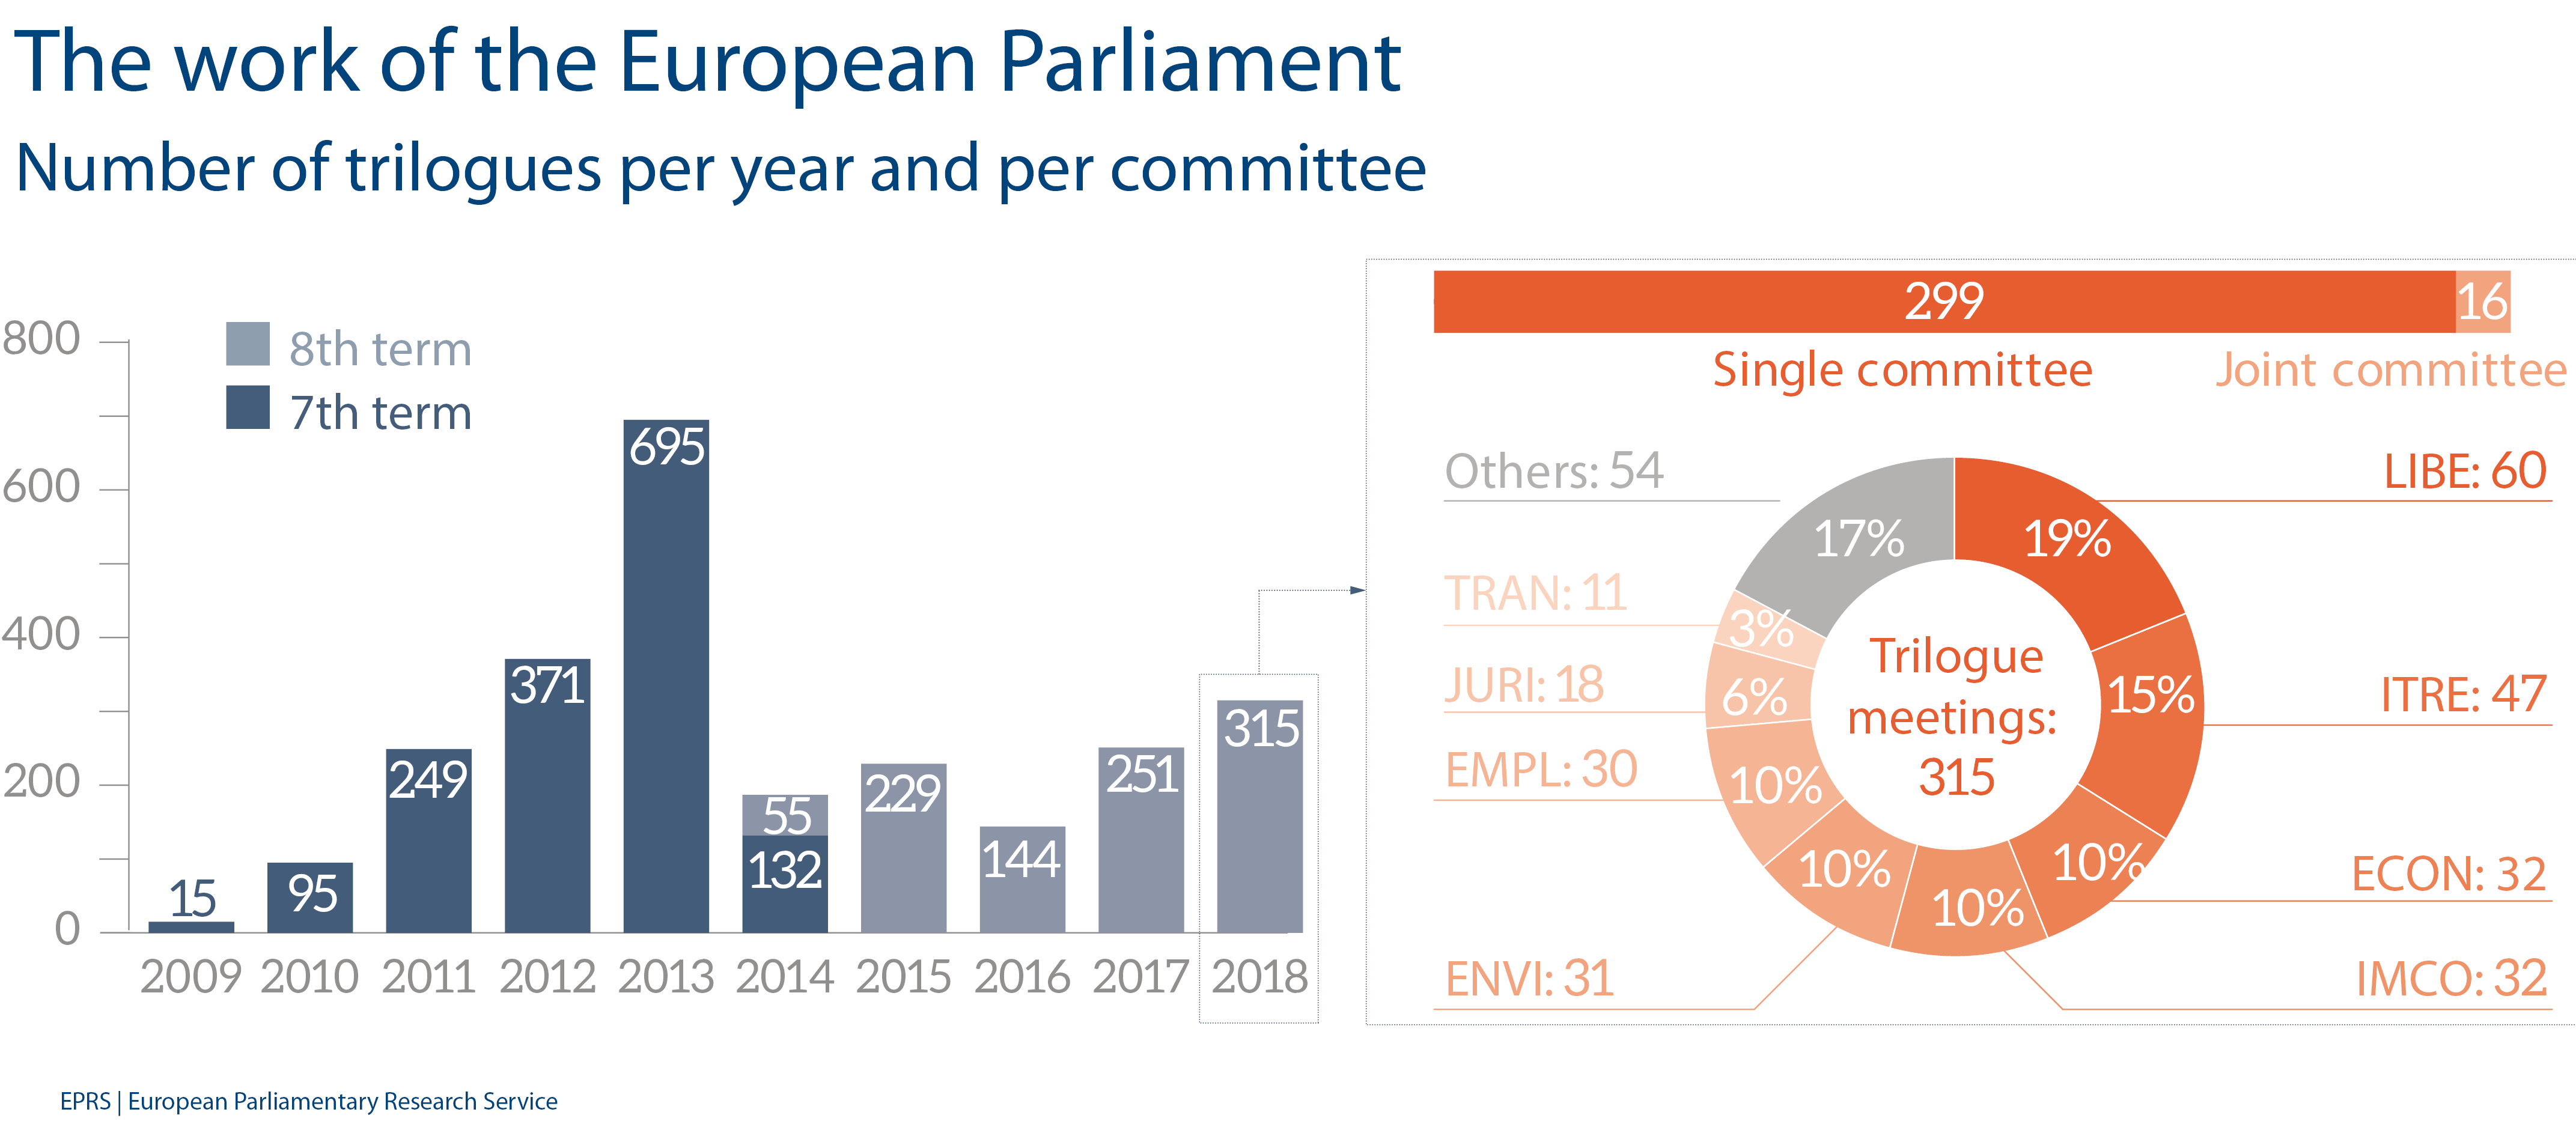
In the eighth term so far (from July 2014 to December 2018), EP committees have participated in a total of 994 trilogue meetings with the Council and Commission. The bar graph below shows the number of trilogues held by year since the beginning of the seventh term, with a peak in 2013, notably reflecting key decisions on programmes within the 2014-20 Multiannual Financial Framework.
In 2018, out of 315 trilogues, 299 had a single committee participating, while in 16 two committees were involved in the meeting. The pie chart shows which parliamentary committees were most involved in trilogues in 2018, the fourth full year of the 2014-19 term. It highlights the eight most active committees in terms of trilogues held, as a percentage of the total.






Be the first to write a comment.