
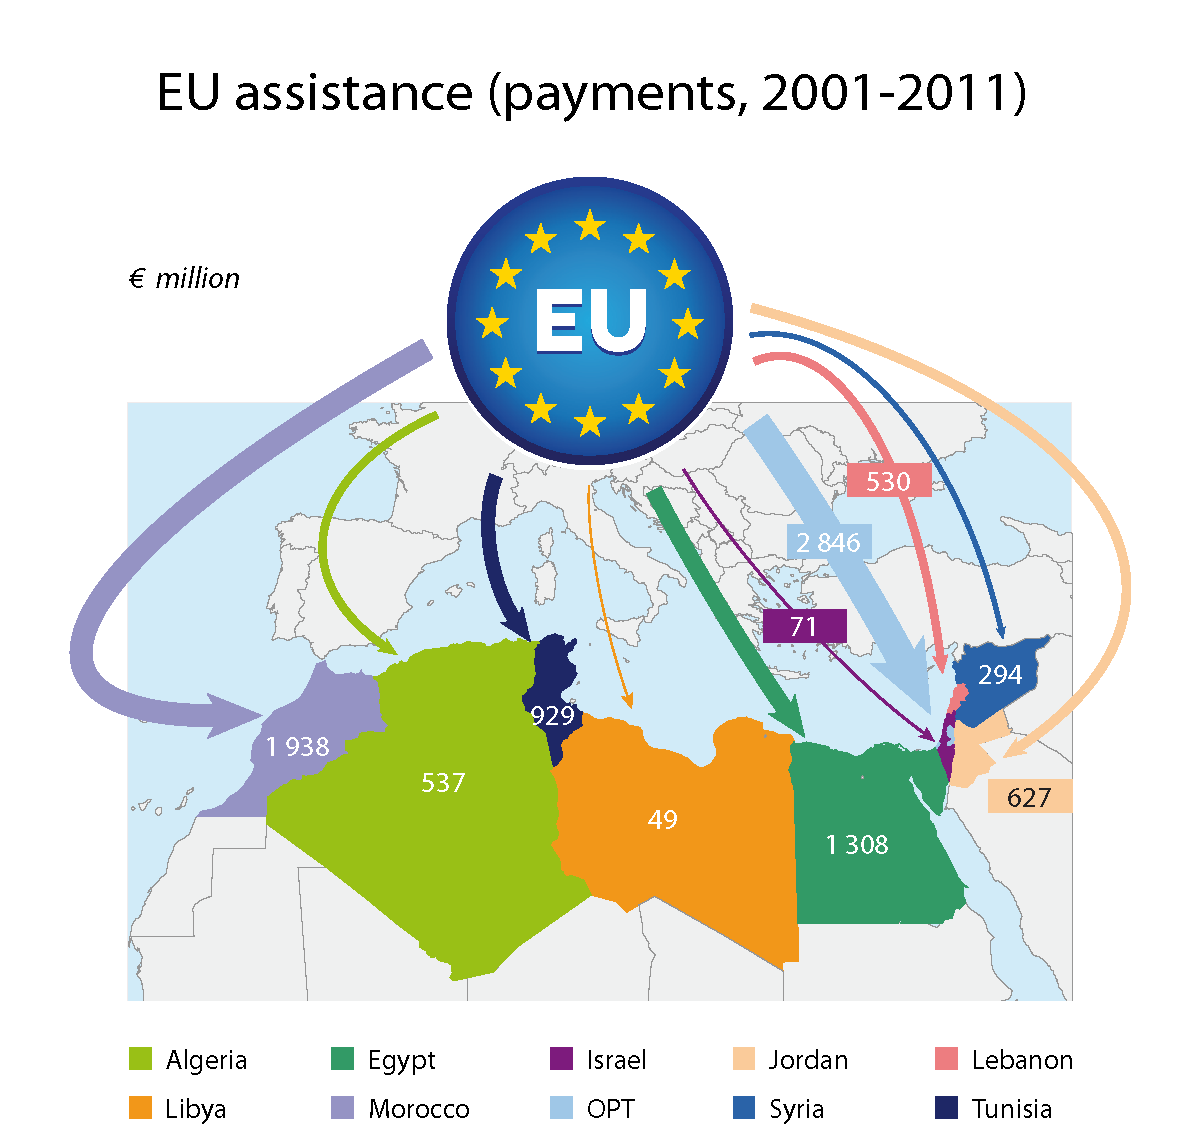
The map shows the EU financial assistance paid to the ten countries as set out in the annual reports of the European Commission’s Directorate General for Development and Cooperation – EuropeAid (DG DEVCO). It presents the total payments from 2001 to 2011 divided by recipient country. The pie chart shows the division of the total amongst the ten countries in percentage terms.

EU assistance to the EU’s southern Mediterranean neighbours (payments, 2001 – 2011)
Categories:
Related Articles
Visit the European Parliament page on
We write about
RSS Link to Scientific Foresight (STOA)
RSS Link to Members’ Research Service
Blogroll
Disclaimer and Copyright statement
The content of all documents (and articles) contained in this blog is the sole responsibility of the author and any opinions expressed therein do not necessarily represent the official position of the European Parliament. It is addressed to the Members and staff of the EP for their parliamentary work. Reproduction and translation for non-commercial purposes are authorised, provided the source is acknowledged and the European Parliament is given prior notice and sent a copy.
For a comprehensive description of our cookie and data protection policies, please visit Terms and Conditions page.
Copyright © European Union, 2014-2019. All rights reserved.


I would like to know how much of the EU assistence payments returns back in terms of economic growth for the EU.
Dear Flaviano,
Thank you very much for your interest in the topic!
As you know, this is a rather complex question. You may find some answers already on EuropeAid pages: http://ec.europa.eu/europeaid/what/economic-support/index_en.htm
If you need more information, please be so kind and use one of these channels: http://www.europarl.europa.eu/aboutparliament/en/00020472ac/Citizens'-Enquiries.html
Best regards
Thank you!



