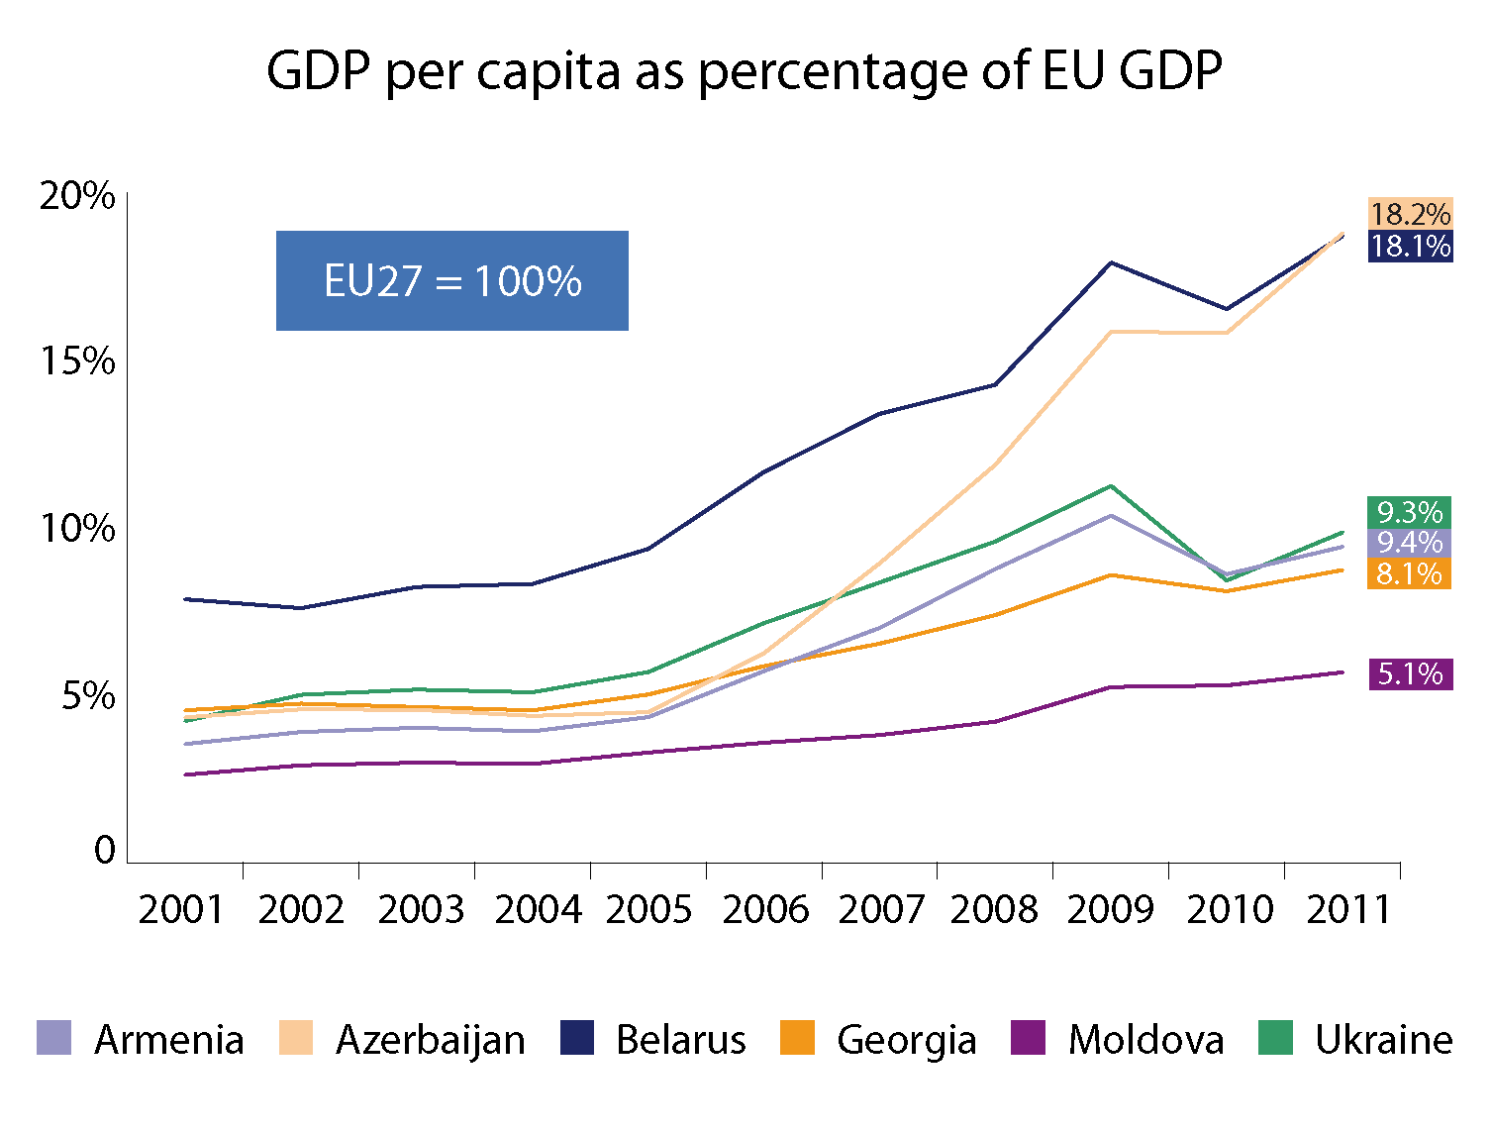
The line chart shows gross domestic product (GDP) per capita for the six countries expressed as a percentage of EU GDP. The values at the end of each line are the latest values available for each country (2011). This index is a calculation by the author based on data published by the World Bank.
By EPRS Admin
/ March 19, 2013
GDP per capita of EU eastern neighbourhood countries as percentage of EU GDP 2001-2011
Categories:
Related Articles
Visit the European Parliament page on
We write about
RSS Link to Scientific Foresight (STOA)
RSS Link to Members’ Research Service
Blogroll
Disclaimer and Copyright statement
The content of all documents (and articles) contained in this blog is the sole responsibility of the author and any opinions expressed therein do not necessarily represent the official position of the European Parliament. It is addressed to the Members and staff of the EP for their parliamentary work. Reproduction and translation for non-commercial purposes are authorised, provided the source is acknowledged and the European Parliament is given prior notice and sent a copy.
For a comprehensive description of our cookie and data protection policies, please visit Terms and Conditions page.
Copyright © European Union, 2014-2019. All rights reserved.
Be the first to write a comment.