

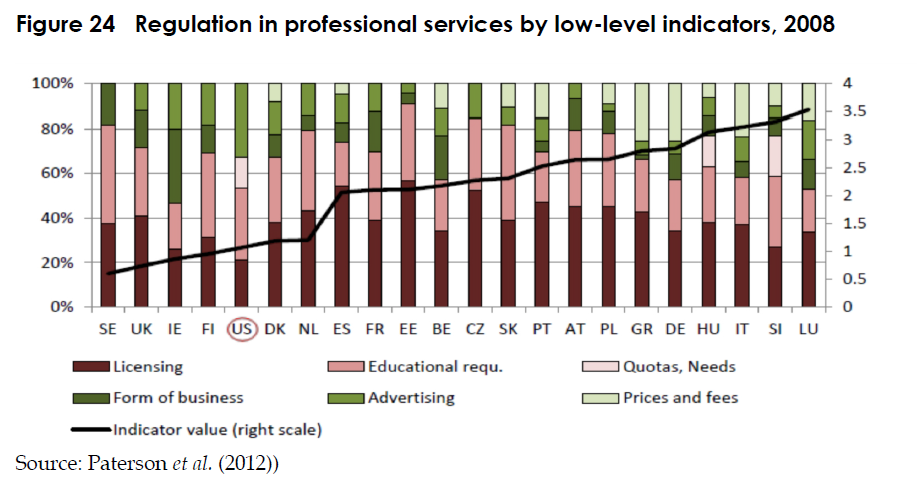
Figure 24 displays the level of restrictions according to different scales: on the right scale,
the overall score is reported for OECD countries while on the left side, the percentage
composition of the different dimensions is provided. Different observations can be on
this Figure. First, the majority of EU countries are characterized by a level of anticompetitive
regulation that is higher than the OECD average. Moreover, a few countries
such as the UK, Ireland, Finland and Sweden have an overall level of restrictions that is
lower than the one reported for the United States. As mentioned, the left axis reports the
contribution of each dimension: it can be easily observed that, regardless the overall level
of anti-competitive regulation present in each country, the main contributors are always
(except in the case of Ireland) represented by licensing and educational requirements.
Instead, conduct regulations, mainly in the form of business and advertising are
relatively less relevant.






Be the first to write a comment.