
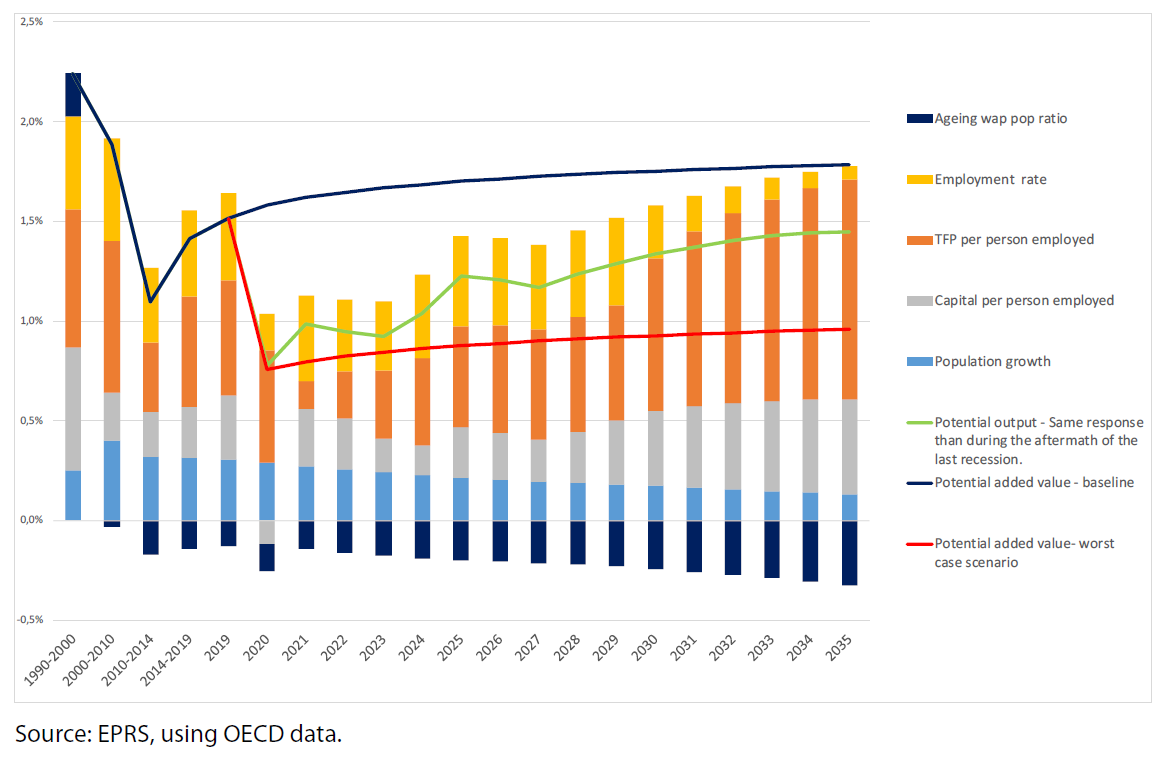
The impact of the simulated shock on potential added value and on its components is represented in Figure 4 below. Capital per person employed is recovering from year three, although at an inferior rate to that observed for the initial baseline scenario. The growth rate at the end of the simulation horizon almost reaches 0.5 %, slightly below the result observed in the baseline scenario. The TFP also initially grows moderately, before finally recovering to 1.1 % in 2035, a level still 0.2 percentage points below the level of the initial baseline scenario. Employment rate growth is sustained, but rapidly declines below the level observed for the initial baseline at the end of the simulation horizon. In such a scenario, potential added value growth is initially rather disappointing. This affects long-term prospects, as potential growth in 2035 reaches only 1.4 %; still 0.4 percentage points below the value for the initial baseline. From 2020 to 2035, this would represent a cumulated €1.8 trillion of added value losses for the EU as a whole compared to the initial baseline scenario.


Be the first to write a comment.