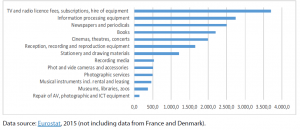
An analysis of household expenditure on cultural goods and services is important in the context of access to culture. A 2016 French publication pointed to a rise in cultural expenses from 4.4 % in 1980 to 6 % in 2000, but showed that the purchase of equipment, payment of TV and internet subscription fees, and the purchase of cultural goods and services proper are not evenly distributed. Figure 1 supports this analysis − 46 % of cultural expenses are devoted to equipment and fees; 37 % to books, periodicals, newspapers, and cinema, theatre, and concert tickets; and 17 % to photographic and cinematographic equipment and accessories, repairs of such equipment, photographic services, musical instruments, stationary, and drawing materials. All of these expenses go to support users’ self-expression and content production. The data cast new light on the growth of expenditure on cultural goods and services. Almost half of it goes to equipment and various access fees that do not necessarily or directly contribute to cultural production or to artists/creators’ revenues. Moreover, often customers are not ready to pay for the content in addition.
Figure 1 − Households expenditure on cultural goods and services by consumption purpose
Households’ expenditure on cultural goods and services by consumption purpose (in purchasing power standard)
Visit the European Parliament page on
Visit the European Parliament page on
We write about
RSS Link to Scientific Foresight (STOA)
RSS Link to Members’ Research Service
Blogroll
Disclaimer and Copyright statement
The content of all documents (and articles) contained in this blog is the sole responsibility of the author and any opinions expressed therein do not necessarily represent the official position of the European Parliament. It is addressed to the Members and staff of the EP for their parliamentary work. Reproduction and translation for non-commercial purposes are authorised, provided the source is acknowledged and the European Parliament is given prior notice and sent a copy.
For a comprehensive description of our cookie and data protection policies, please visit Terms and Conditions page.
Copyright © European Union, 2014-2019. All rights reserved.


Be the first to write a comment.