
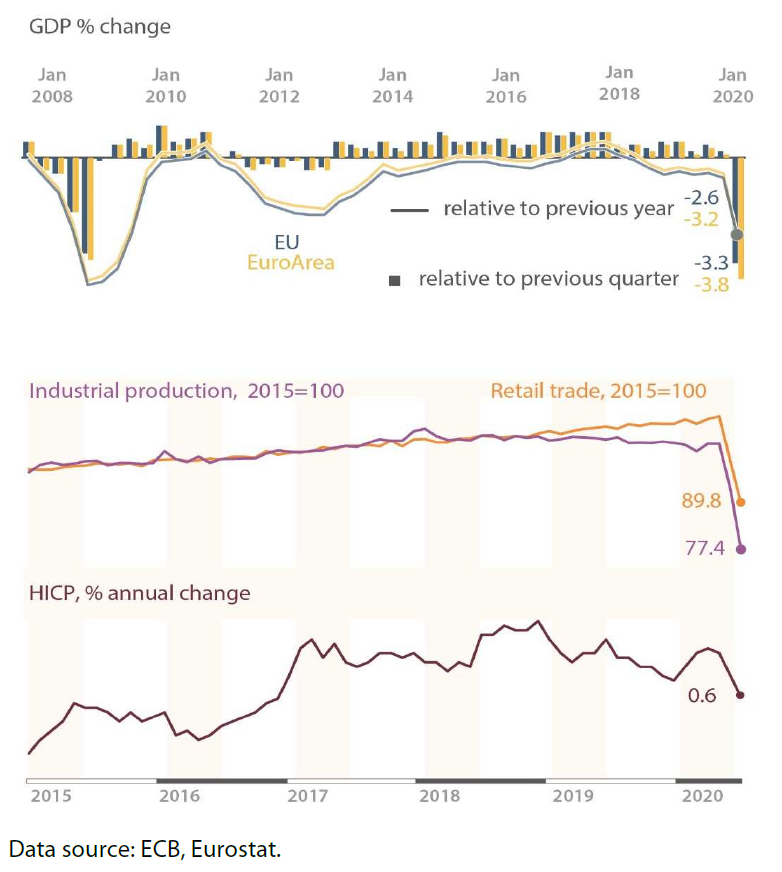
The pandemic, which rapidly engulfed the world in spring 2020, is considered very likely to cause the deepest economic contraction since the Great Depression of the 1930s, which makes it markedly worse than the global financial and economic crisis of 2008. Indeed, preliminary data indicate that the scale of economic damage this time around is much higher. In the depth of the 2008 crisis, EU GDP shrunk by 2.5 % in first quarter of 2009, compared to the previous quarter. Data from 2020 show that EU GDP plummeted by 3.5 % in the first quarter of 2020, compared to the last quarter of 2019. Statistics on industrial production is even more staggering – between February and April 2020, production decreased by 27.7 %. In the worst contraction period of the 2008 crisis, it took five months (from October 2008 to February 2009) for industrial output to decrease by 10.7 %. Other indicators point to a similar trend. Most economists predict that the headline Harmonised Index of Consumer Prices (HICP) inflation will plummet into negative territory, signalling dangerous deflationary pressures on the economy, caused by a massive shock to demand and an equally substantial drop in oil and non-food commodity prices.
The euro-area Purchasing Managers’ Index (PMI), which indicates the overall health of the economy, is closely watched as it signals expansion or contraction, depending on whether it is above or below the neutral 50 threshold. It was at 51.6 in February, and then tumbled to 29.7 in March, and then to an all-time low of 13.6 in April. The previous record-low of 36.2 was in February 2009, which indicates that the present downturn is much more severe than at the height of the global financial crisis.


Be the first to write a comment.