
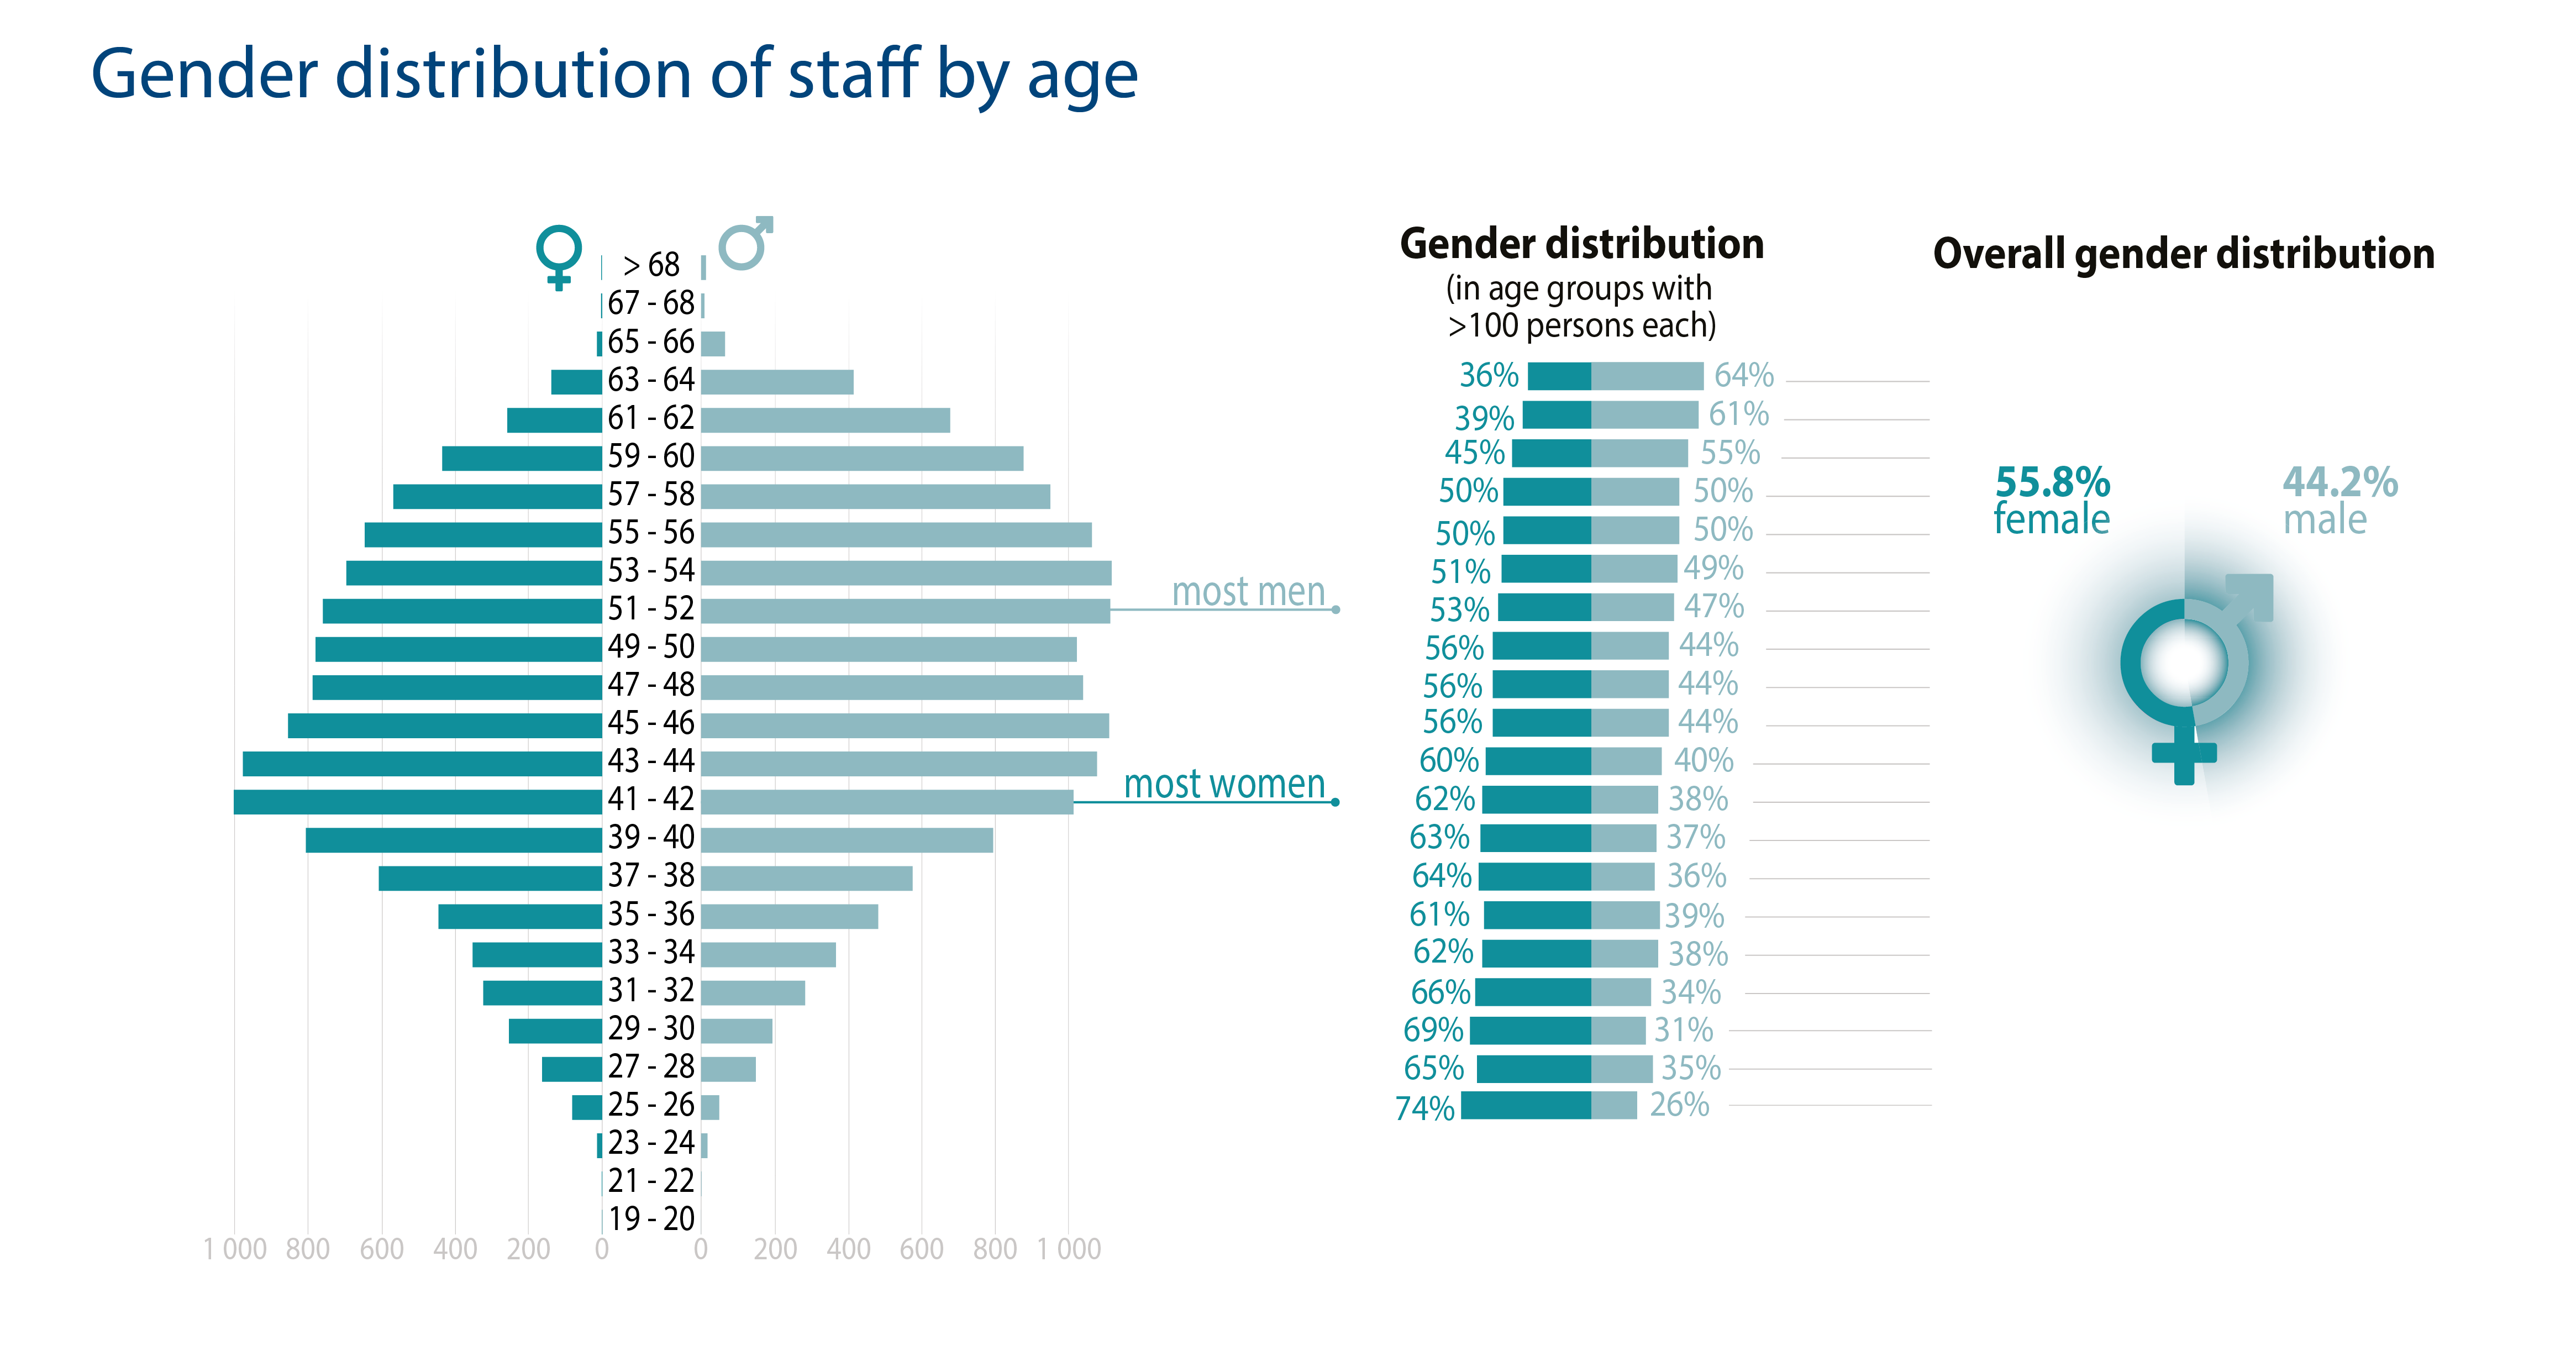
The graph on the left below shows the number of women and men among the Commission’s staff per two-year age group. Women aged 41 and 42 constitute the largest age group overall, at 1 672 persons. Men aged 53 and 54 are the most numerous among their gender, at 1 118. Persons aged 43 and 44 constitute the largest age group overall (2 709). Focussing on those age groups with a minimum of 100 persons (between 25 and 64 years of age), the gender distribution is noticeably skewed. While the ratio of women to men is highest aged 25 and 26, at 74 %, the share of women in each age group steadily decreases with increasing age – with men becoming more numerous as of the age of 59 and 60. Data on these graphs are based on a total of 32 791 staff (see page 5).


Be the first to write a comment.