
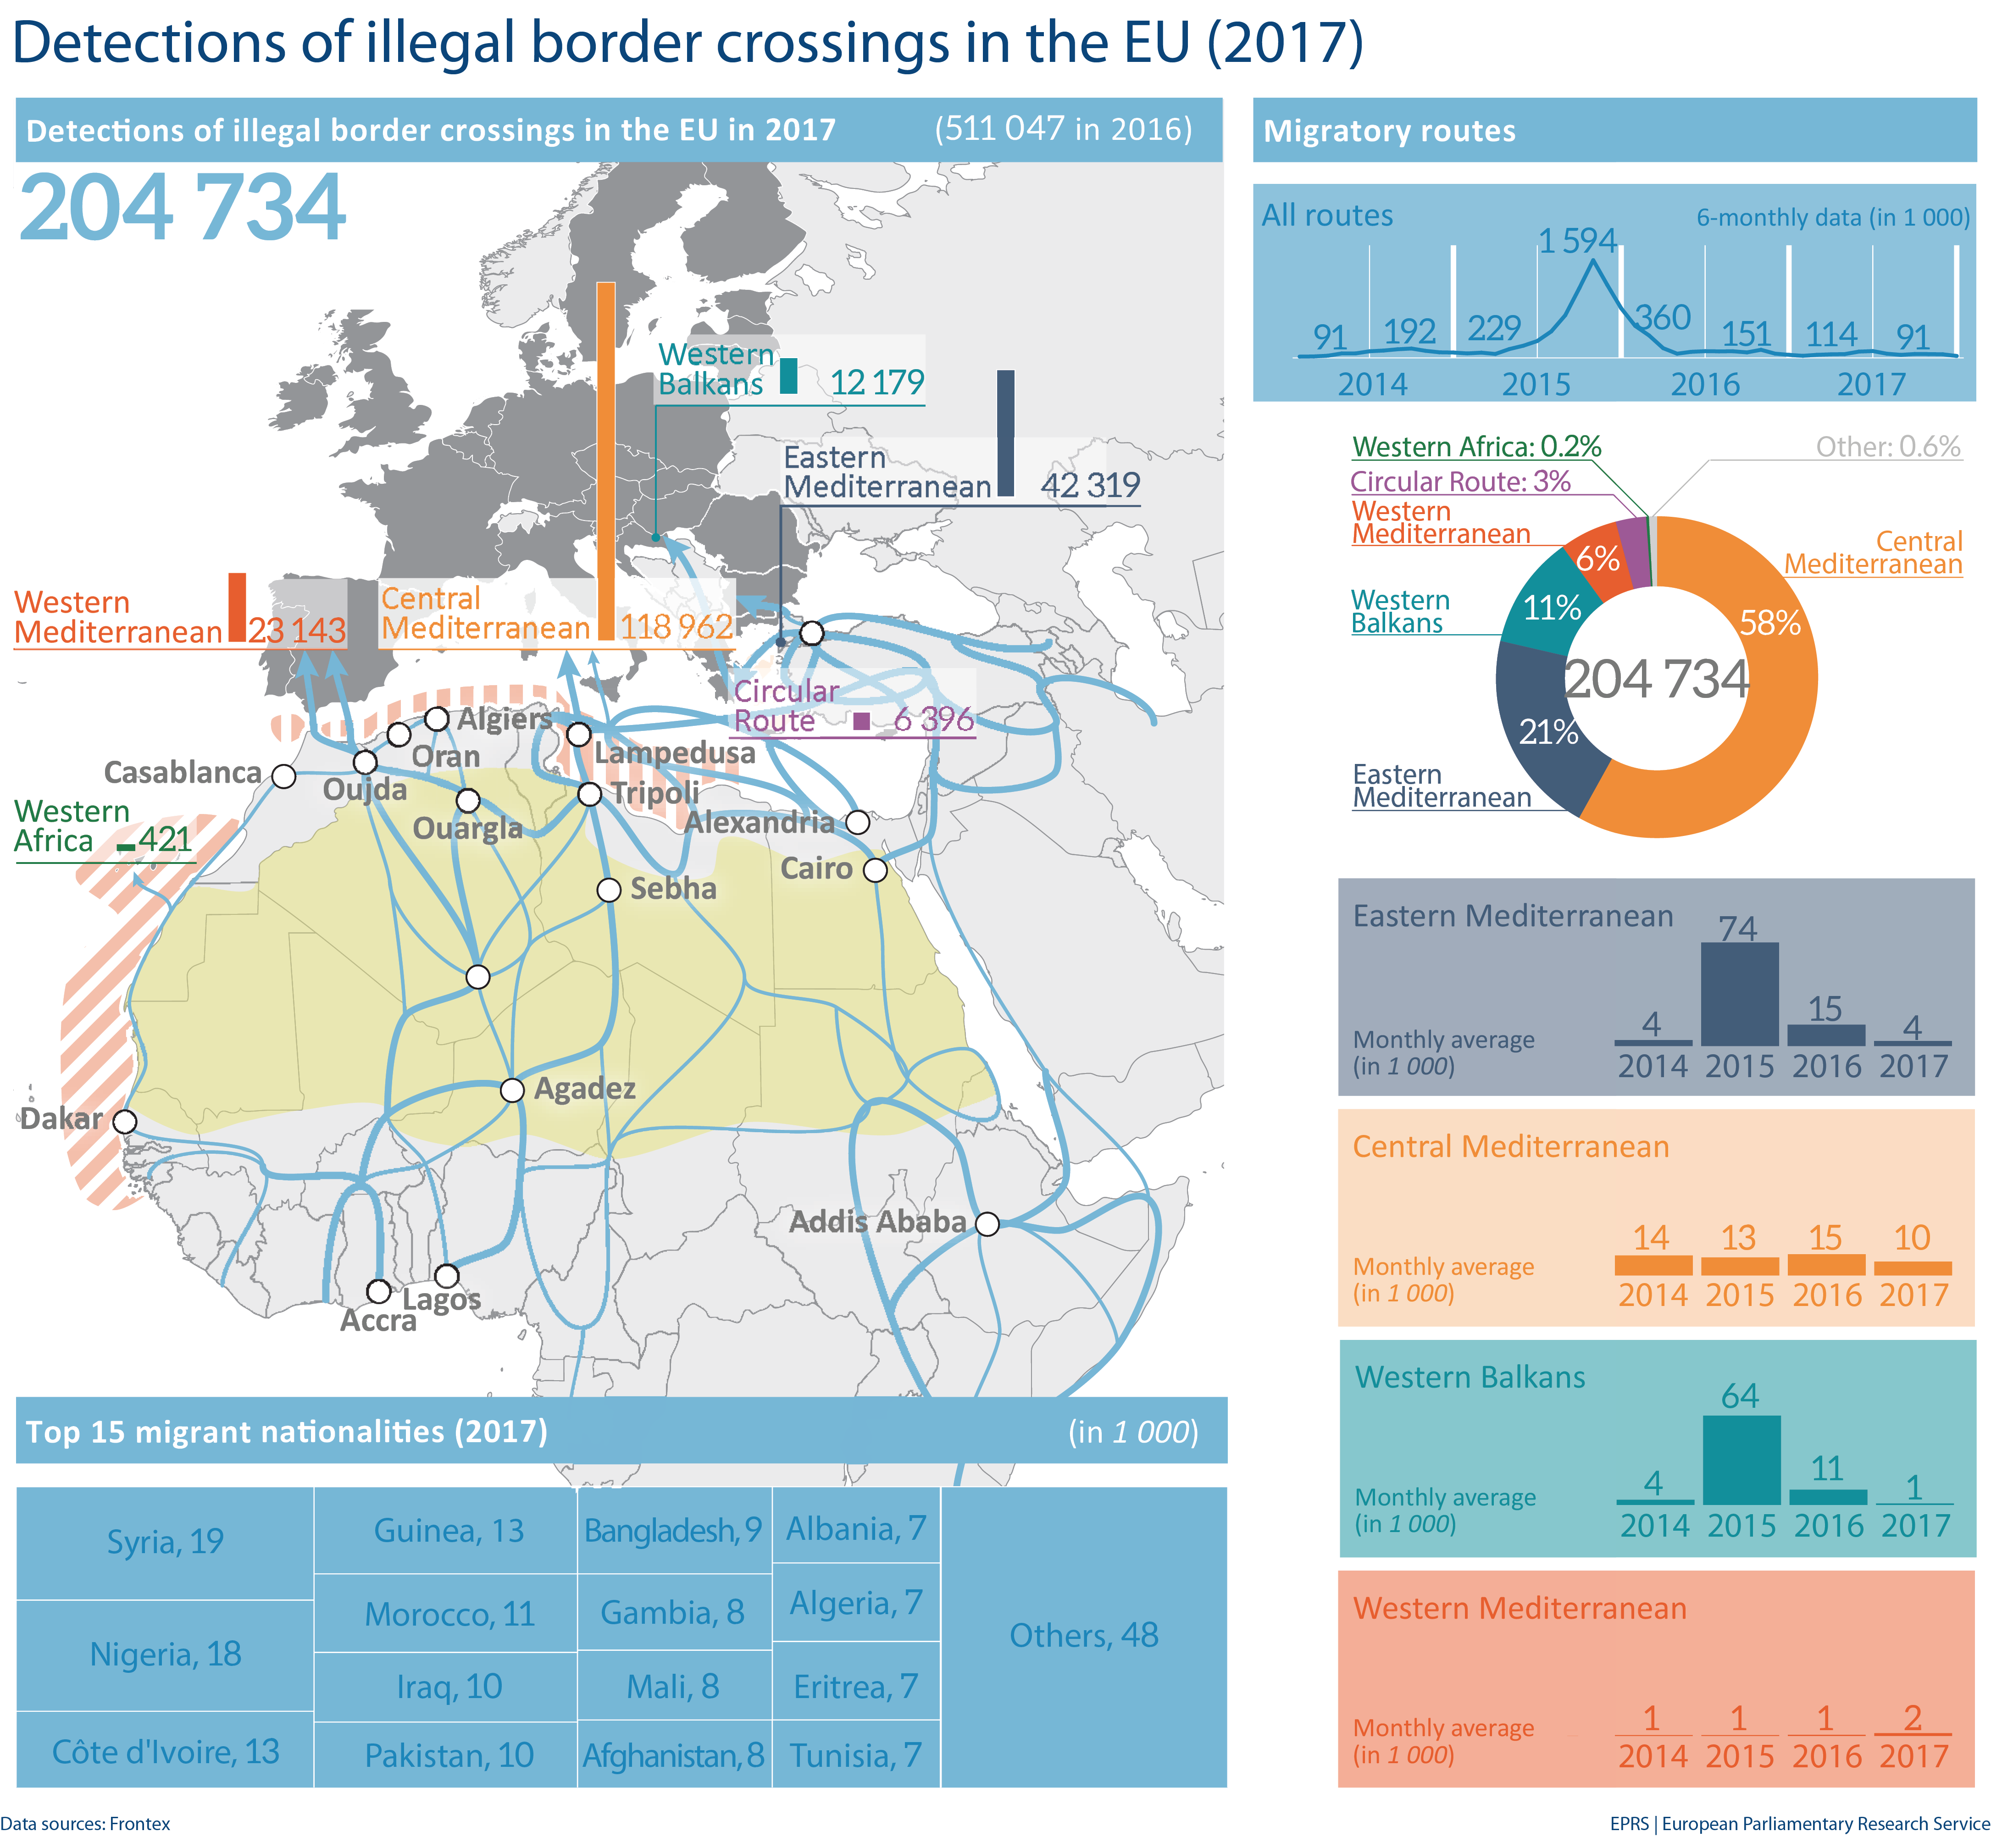
The map shows the different routes and the number of illegal entries into the EU in 2017 for each route. The line chart shows the number of illegal crossings at six-monthly intervals, and the pie chart the share that each route represents in the total. The four boxes below denote the monthly average number of illegal border crossings for each route. The table shows the top 15 nationalities of migrants.


Be the first to write a comment.