
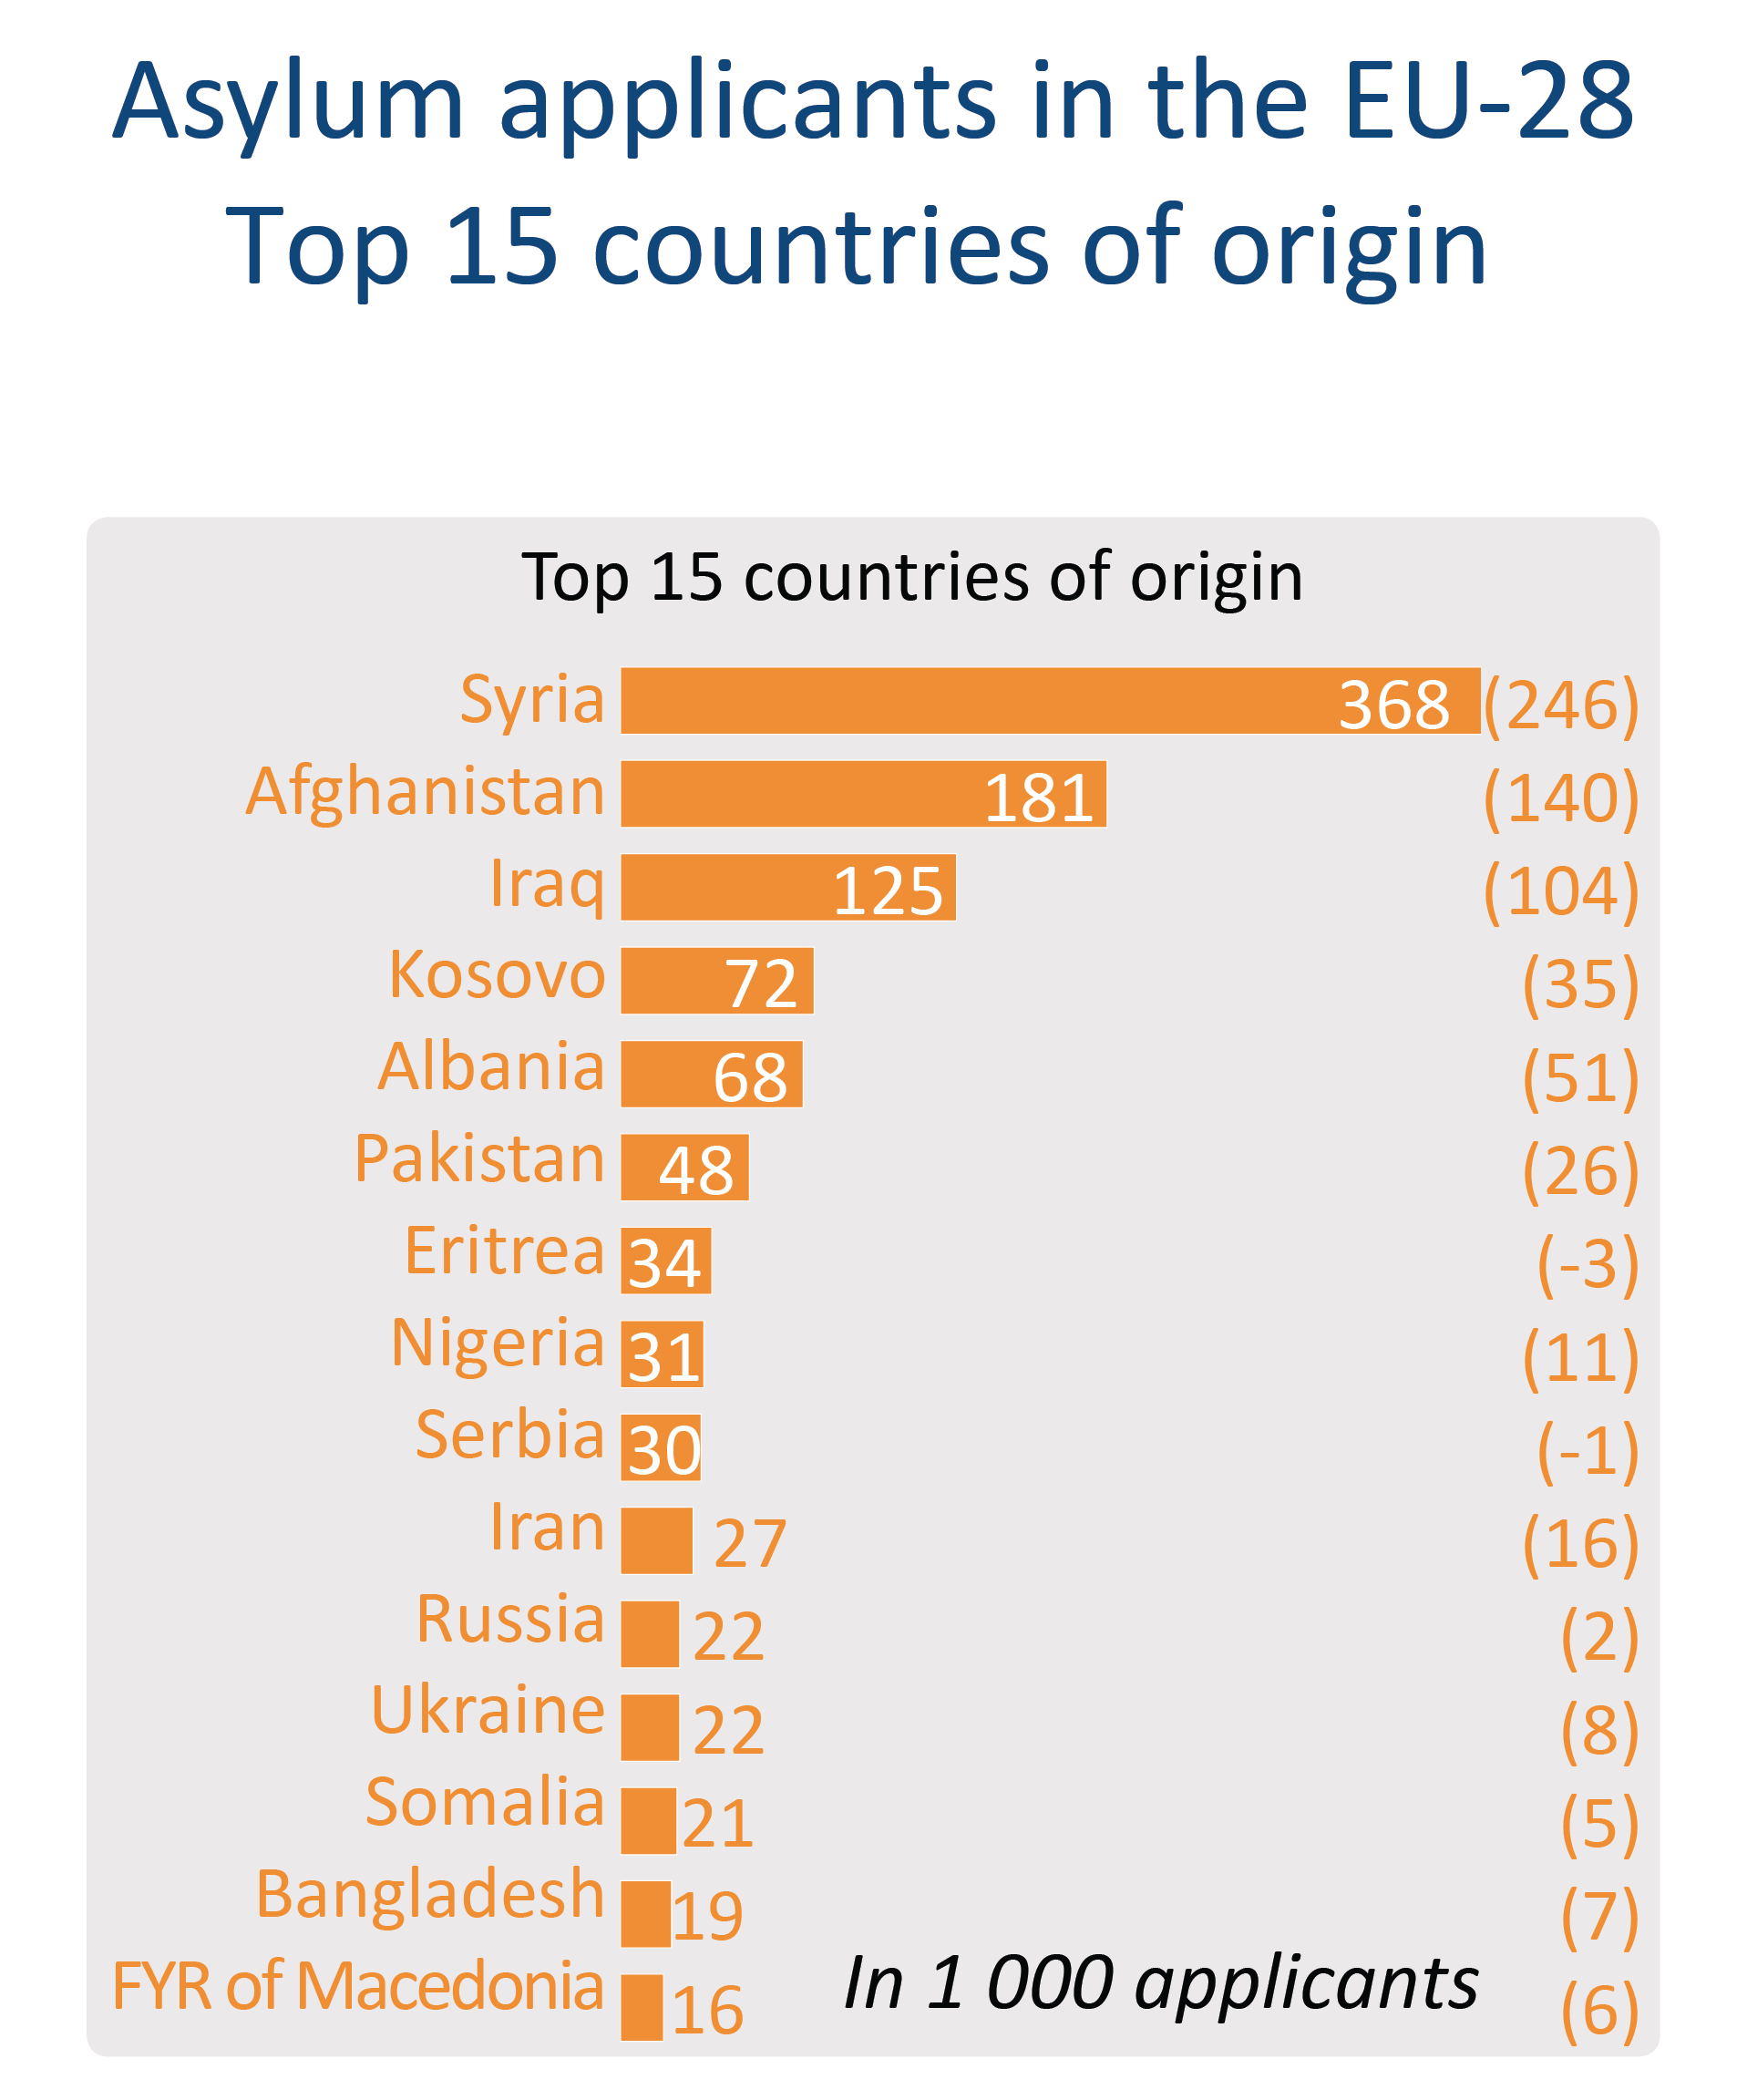
The horizontal bar chart shows the top 15 countries of origin for the year 2015. The value in parenthesis represents changes with respect to 2014; a positive value shows an increase, and a negative a decrease (e.g. there was an increase of 246 000 applicants from Syria in 2015).


Be the first to write a comment.