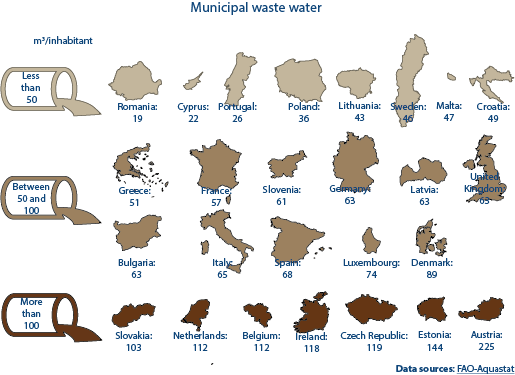
The chart shows the amount of treated municipal wastewater per capita of the resident population in each Member State. For Belgium, Bulgaria, Czech Republic, Denmark, Malta and Slovakia, municipal wastewater produced is shown.

 / June 1, 2015
The chart shows the amount of treated municipal wastewater per capita of the resident population in each Member State. For Belgium, Bulgaria, Czech Republic, Denmark, Malta and Slovakia, municipal wastewater produced is shown.






Be the first to write a comment.