Here you’ll find graphs, charts, tables and maps with statistics on regions, tourism and transport. To see graphics for other…
Here you’ll find graphs, charts, tables and maps with statistics on regions, tourism and transport.
To see graphics for other policy areas, go to the Graphics Warehouse.
Graphics on Research and Information society
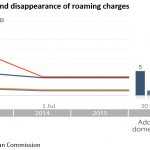
Steady reduction and disappearance of roaming charges
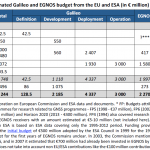
Estimated Galileo and EGNOS budget from the EU and ESA (in € million)
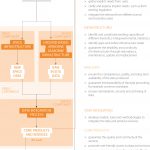
Organisation of Copernicus and key challenges of the programme
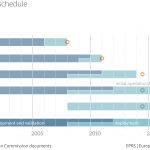
The evolution of Galileo’s timetable
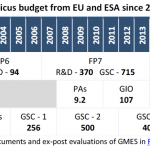
Estimated Copernicus budget from EU and ESA since 2002 (in million €)
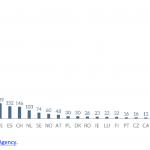
Figure 1 – Provenance of the ESA budget for 2016 (in € million)
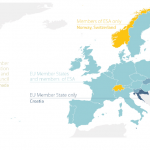
Figure 2 – EU and ESA member states
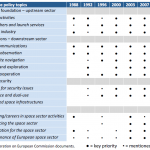
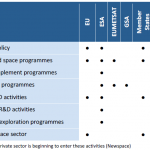
Table 1 – European space policy priorities in Commission communications
Table 2 – Roles of the different actors in the European space sector
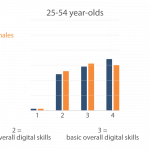
Digital skills of women and men in different age groups
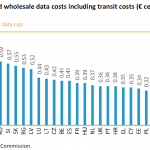
Estimated wholesale data costs
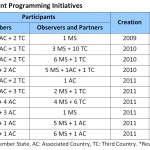
Key figures of the Joint Programming Initiatives
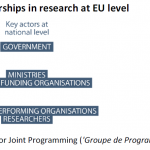
Public-public partnerships in research at EU level
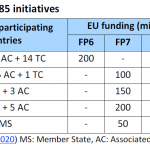
Key figures of the Article 185 initiatives
Key figures of the ERANET scheme (2002-2015)
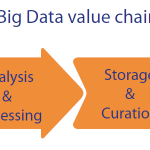
The Big Data value chain
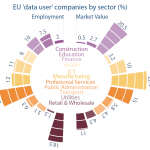
EU ‘data user’ companies by sector (%)
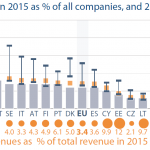
Data users in 2015 as % of all companies, and 2020 forecast
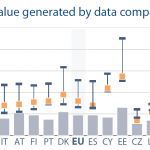
GDP impacts of the estimated value generated by data companies in 2015, and 2020 forecast
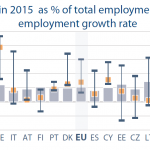
Workers employed in 2015 as % of total employment, and forecast 2020 employment growth rate
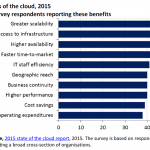
Benefits of the cloud, 2015. % of survey respondents reporting these benefits
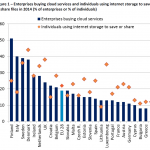
Enterprises buying cloud services and individuals using internet storage to save or share files in 2014 (% of enterprises or % of individuals)
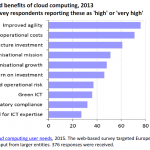
Expected benefits of cloud computing, 2013. % of survey respondents reporting these as ‘high’ or ‘very high’
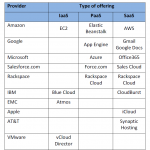
Selected cloud computing offers

 / February 18, 2014


Be the first to write a comment.