
Written by Giulio Sabbati, Martina Prpic with Samy Chahri,
Updated on 25.02.2020
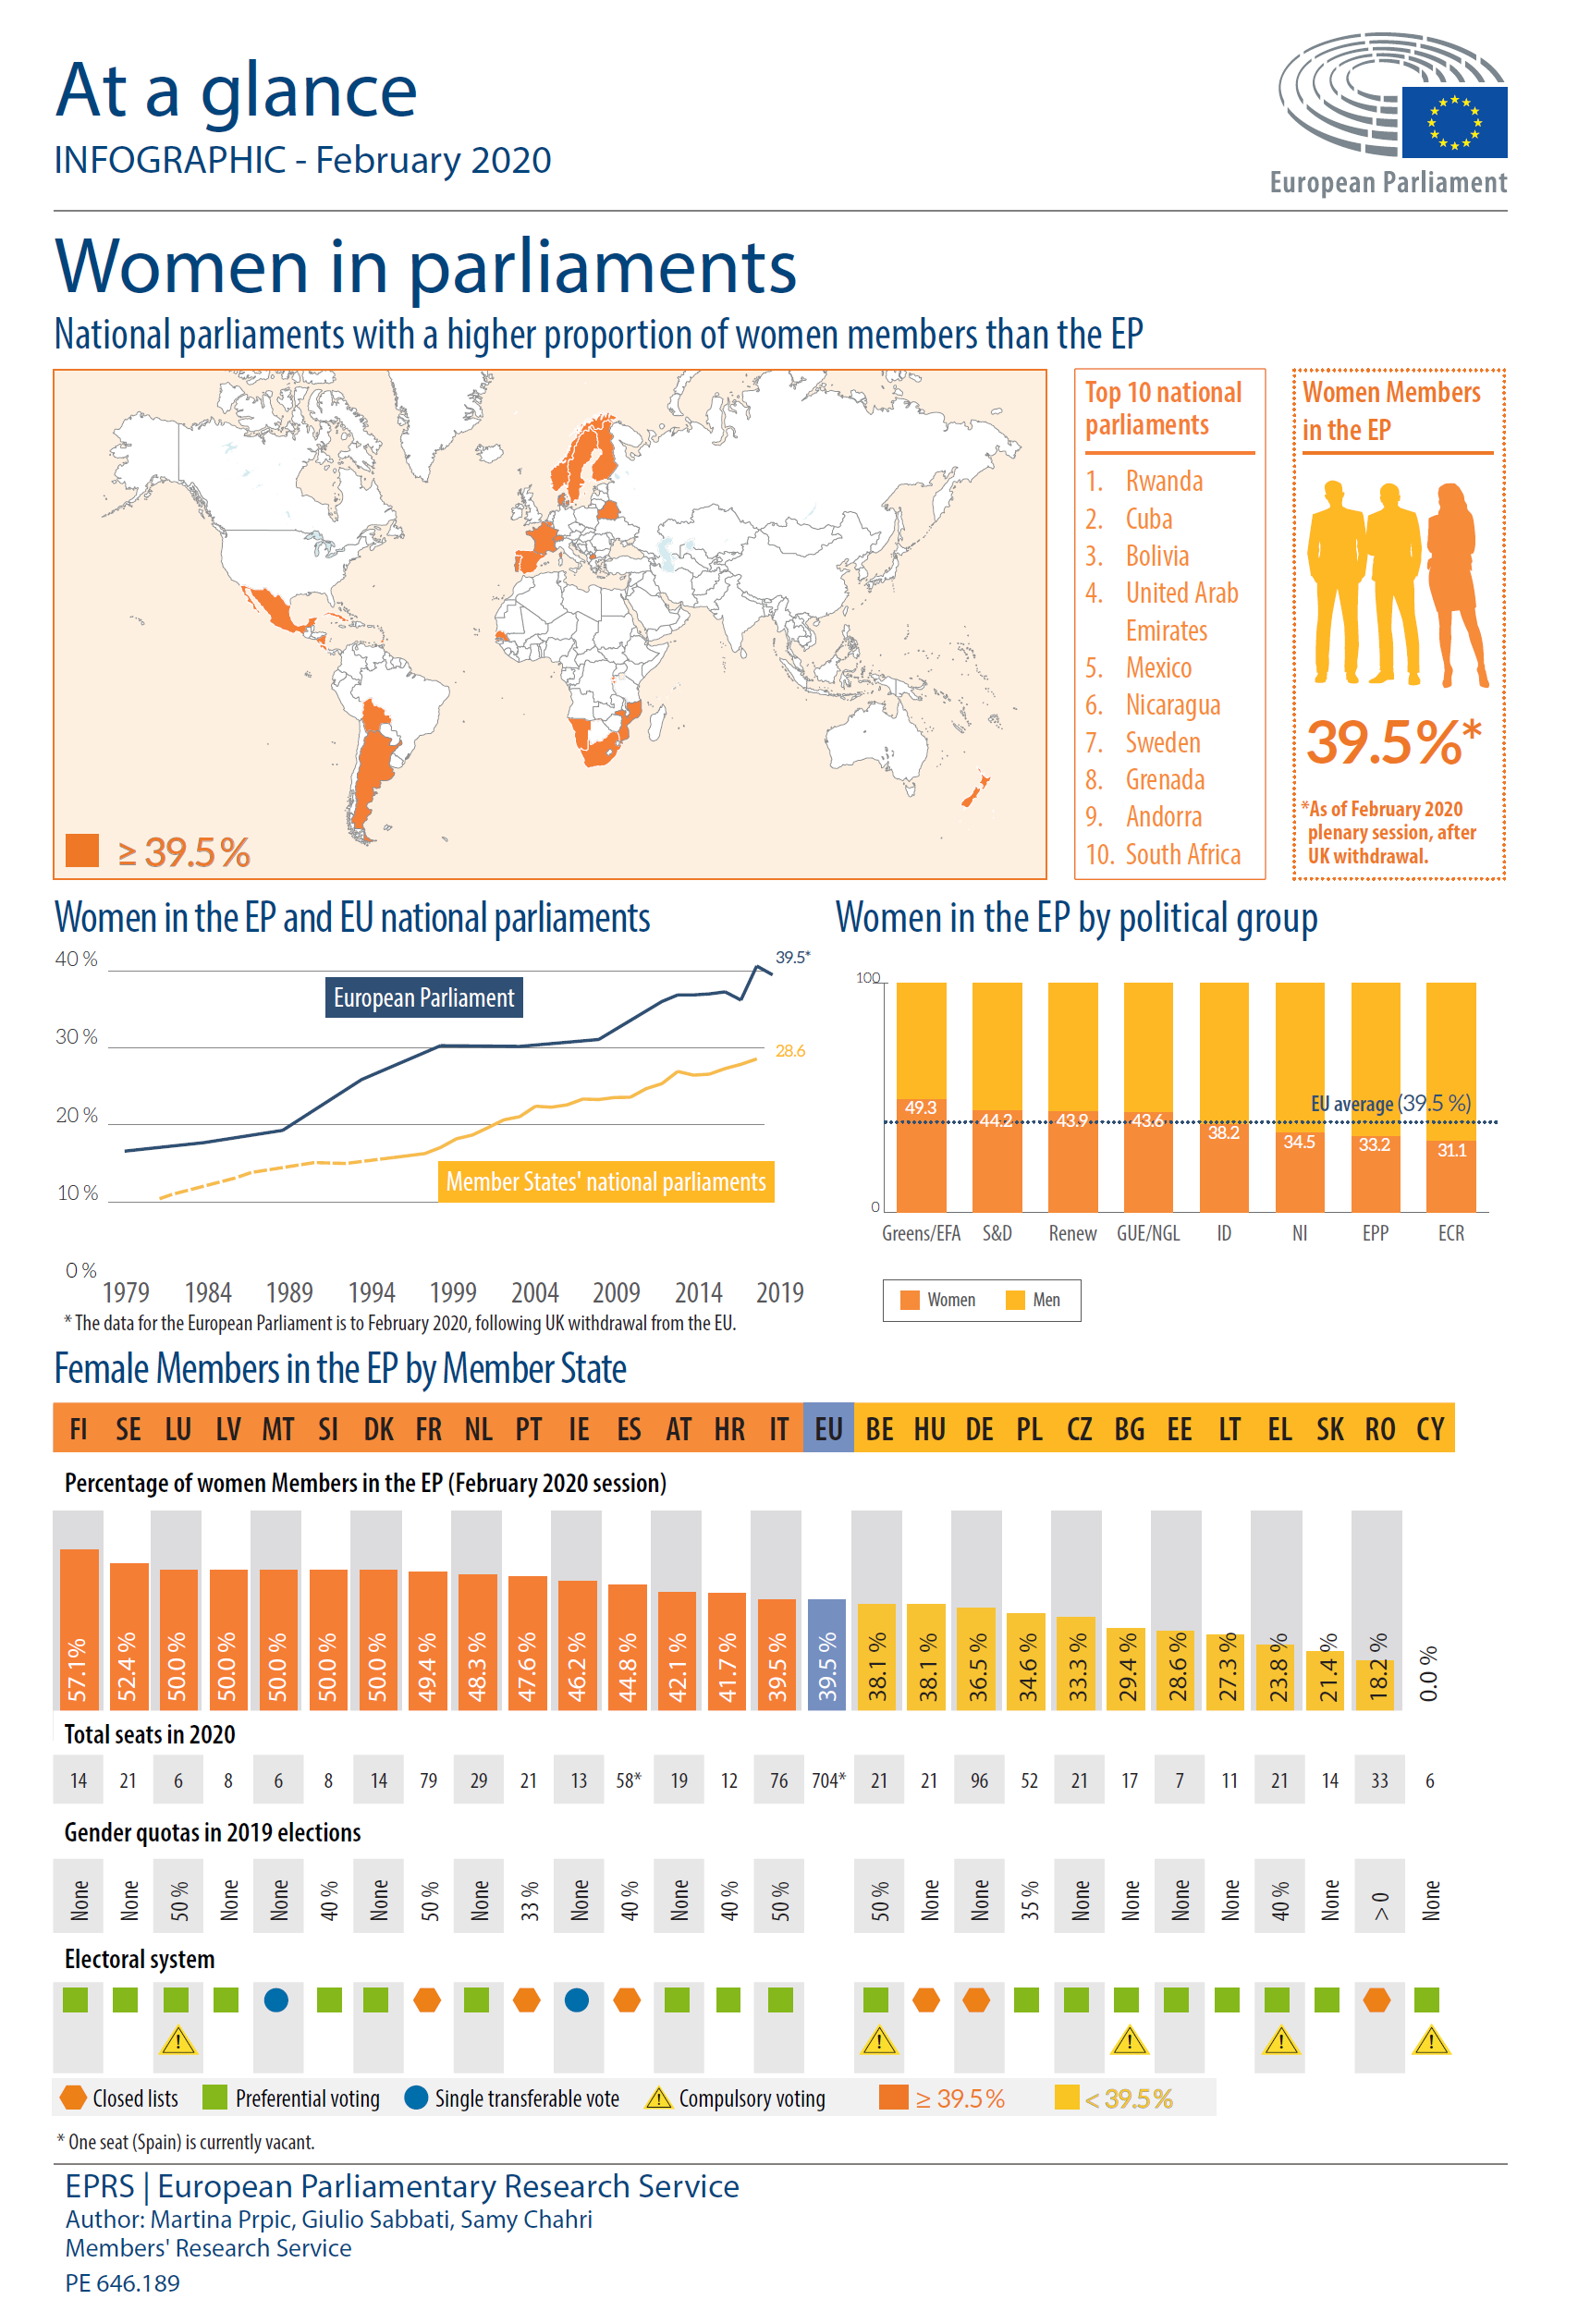
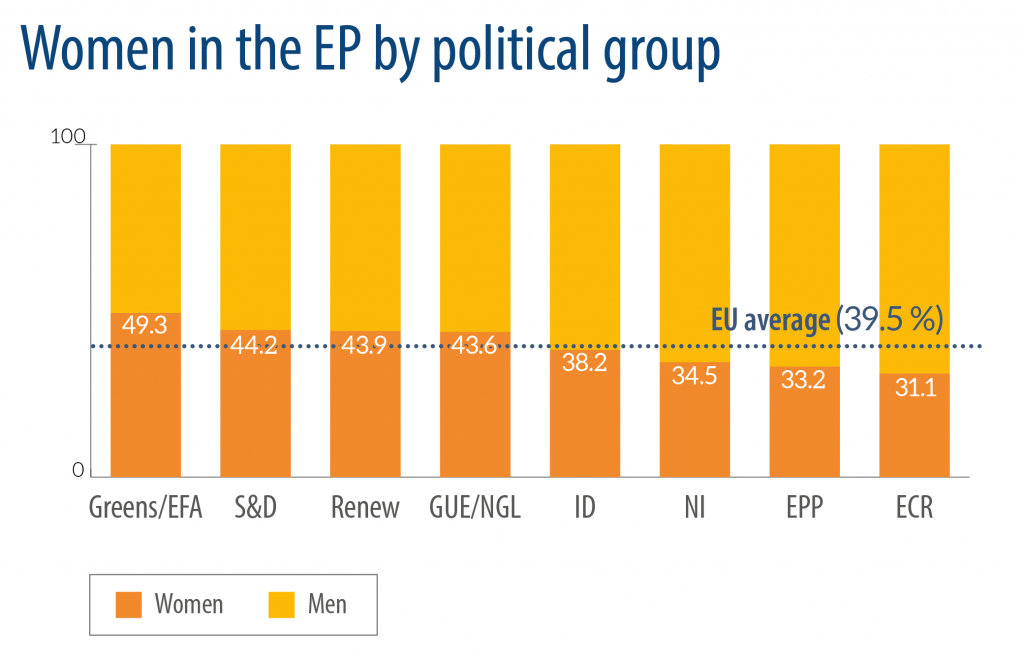
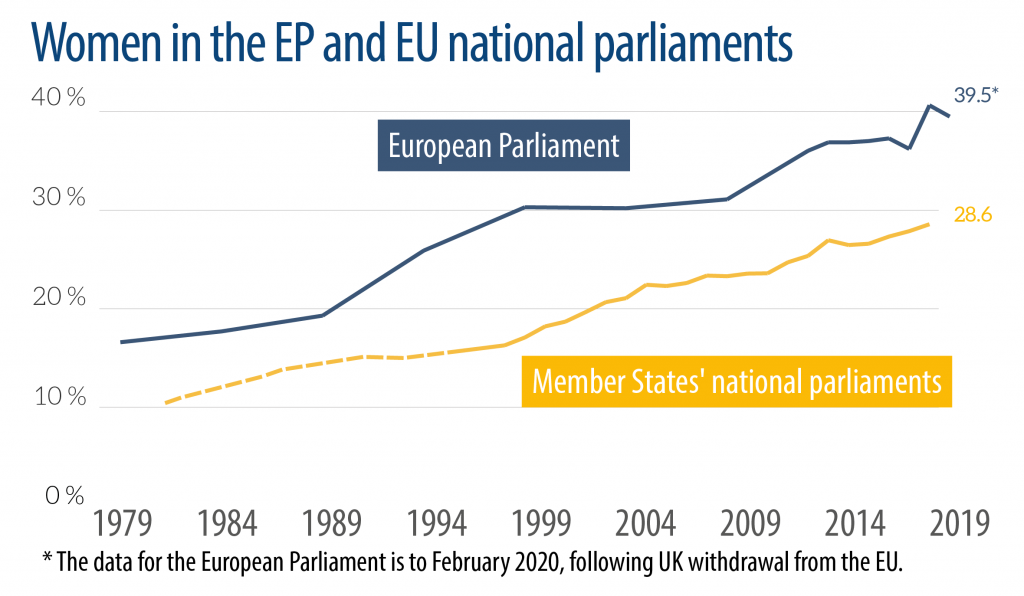
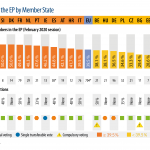
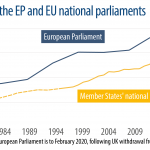
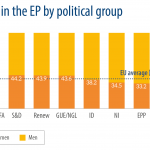
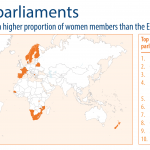
This ‘Women in parliaments‘ infographic provides information on the proportion of women in national parliaments, compares representation of women in national parliaments with their numbers in the European Parliament and shows the number of women in the EP by political group. It also gives an overview of female representatives in the EP by Member State and outlines the gender quotas applicable to the 2019 EP elections.
This is a further updated version of an infographic of which the previous edition was published in December 2019, PE 646.110.
Read the complete ‘at a glance’ note on ‘Women in parliaments‘ on the Think Tank pages of the European Parliament.
Read more on the Parliaments’ fight for gender Equality in the EU.


[…] Women in management positions in private and public sector and in politics. The infographic Women in parliaments provides information on gender representation in the EP and national parliaments. It also reflects […]
[…] Women in parliaments / European Parliament Research Service, At a Glance, March 2014 […]
[…] year’s European elections and what could be done to improve the situation? Our infographic on women in parliaments provides information on the proportion of women in national parliaments and the European Parliament […]
[…] EU: Women in EU Parliaments (via EPRS) […]
[…] Women in parliaments […]
[…] Women in parliaments […]