Here you’ll find graphs, charts, tables and maps with statistics on employment, social issues and pensions. To see graphics for…
Here you’ll find graphs, charts, tables and maps with statistics on employment, social issues and pensions.
To see graphics for other policy areas, go to the Graphics Warehouse.
Graphics on Employment
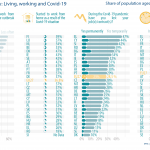
Share of population aged 18 and more, 2020
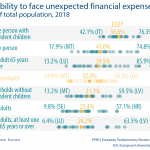
% of total population, 2018
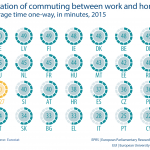
Average time one-way, in minutes, 2015
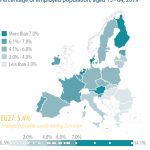
Percentage of employed population, aged 15 – 64, 2019
Percentage of working-age population, 2019
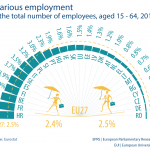
% of the total number of employees, aged 15 – 64, 2019
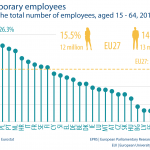
% of the total number of employees, aged 15 – 64, 2019
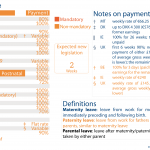
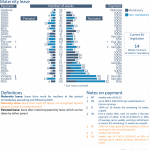
Paternity leave in the EU
Maternity leave in the EU
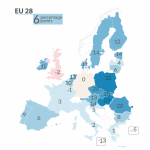
Perception of EU action as adequate at present: percentage points difference between 2016 and 2018
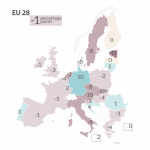
Expectations for more EU action than at present: percentage points difference between 2016 and 2018
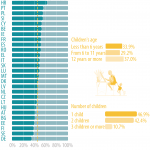
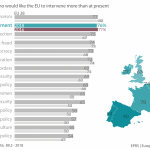
Percentage of respondents who would like the EU to intervene more than at present
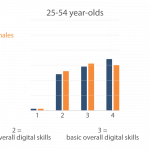
Digital skills of women and men in different age groups
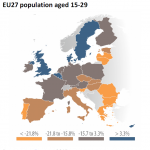
Demographic change 2000-2010, EU27 population aged 15-29
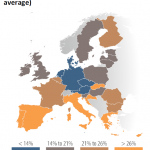
Unemployment rate 2014-2015, EU28 population aged under 25 (annual average)
Graphics on Social issues
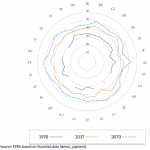
Median age of the population (years) in each of the EU-28 Member States in 1970 and 2017, and projected median age in 2070
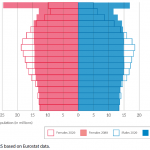
Population pyramids for the EU-28 (number of women and men by age tranches), 2020 and 2080
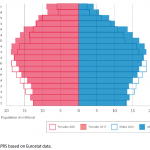
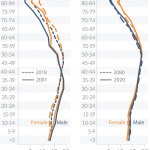
EU-28 population pyramids, 2001 and 2017 (number of women and men by age tranches)
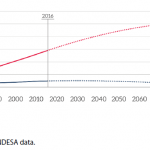
EU-28 and world population (1960=100)
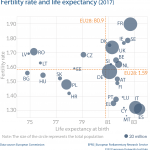
Fertility rate and life expectancy (2017)
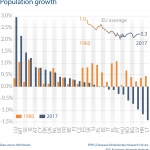
Population growth
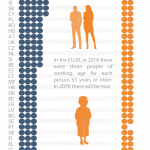
Old-age dependency ratio
Population by age
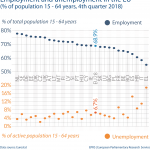
Employment and unemployment in the EU
(% of population 15 – 64 years, 4th quarter 2018)
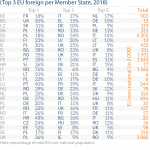
EU non-national population
(Top 3 EU foreign per Member State, 2018)
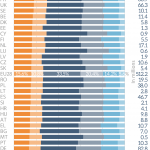
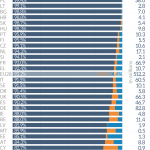
EU population by age group
EU population (2018)
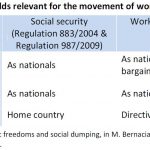
Social policy fields relevant for the movement of workers
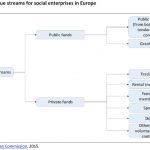
Revenue streams for social enterprises in Europe
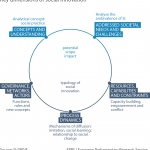
Key dimensions of social innovation
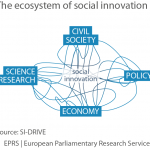
The ecosystem of social innovation
Graphics on Pensions and Social security
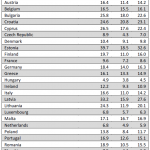
2007: % of people aged 65+ at risk of poverty (AROP)
2014: % of people aged 65+ at risk of poverty (AROP)
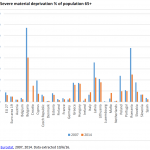
Severe material deprivation % of population 65+
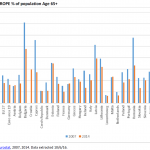
At risk of poverty or social exclusion (AROPE) % of population Age 65+








[…] also our Graphics warehouse for more visual material on employment and social […]