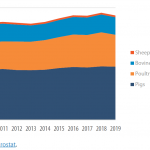
Pig meat production compared with other types of meat production in the EU-28, 2010-2019 (million tonnes)
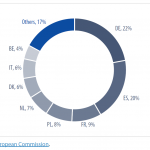
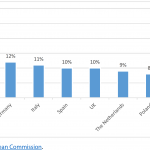
Leading producers of pig meat in the EU-27, 2019 (%)
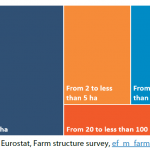
Distribution of the EU pig herd in the EU-28 in 2018 (million heads)
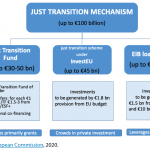
Just Transition Mechanism
Volume of water used for irrigation in the EU in 2010 (% of total cubic metres)
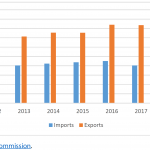
EU poultry meat trade balance in 1 000 euros
EU poultry meat trade balance in 1 000 tonnes CWE
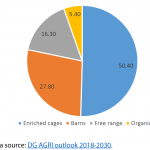
Distribution of laying hens by housing method – 2018
Main egg producers in the EU 2017
Poultry meat production in the EU
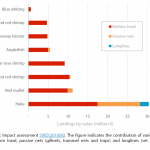
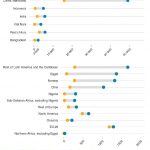
Landings of the main demersal species exploited in the western Mediterranean Sea in 2014 by value (million €)
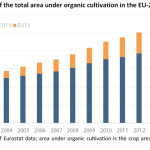
Evolution of the total area under organic cultivation in the EU-28
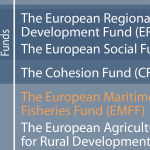
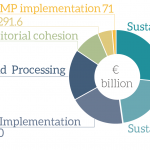
Figure 1 – The European Structural and Investment Funds
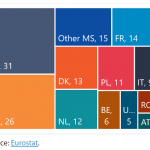
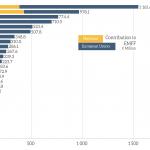
Figure 2 – EMFF allocation per Member State and additional national contributions (€ million, MFF 2014-2020)
Figure 3 – EMFF contribution to the Union priorities (shared management)
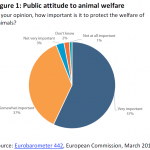
Public attitude to animal welfare
Numbers of RDPs (out of 101 targeting Focus Area 3A) activating measures on FA 3A
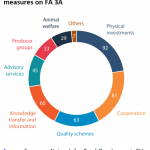
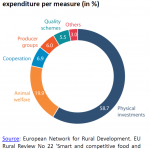
Focus area 3A planned public expenditure per measure (in %)
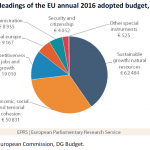
Headings of the EU annual 2016 adopted budget, in € million
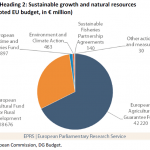
Heading 2: Sustainable growth and natural resources
(2016 adopted EU budget, in € million)
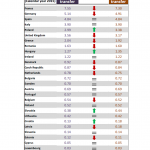
Annual direct payments allocation in 2015 for each Member State, before and after transfer between pillars. (In € billion, current prices)
Graphics on Fisheries
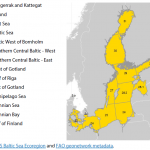
The Skagerrak, Kattegat, Sound, Belt Sea, and Baltic Sea (sub)divisions
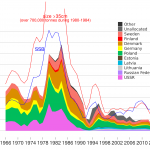
Eastern cod landings by country (1965-2018, in tonnes), including the stock size in terms of spawning stock biomass (SSB) and biomass of commercially sized fish (over 35 cm)
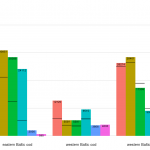
Fishing opportunities for the western Baltic herring and the two Baltic cod stocks (2016-2021, in tonnes) and the level of quota uptake (2016-2019)
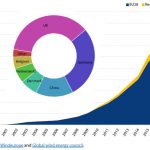
Cumulative offshore wind capacity: trend over time (2000-2017, in gigawatts) and by main countries (2017)
Increase in aquaculture food fish production from 1995 to 2016, by selected major producers in Asia and the rest of the world (in thousand tonnes)
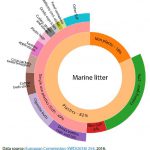
Composition of marine litter found on European beaches (in 2016, share by item count)


[…] Figure 2: The process of the milk’s priceFigure 3: Graph of the EU milk price per ton, data from 2012 to 2015. […]