
Written by Krisztina Binder, Laura Puccio, Giulio Sabbati.
 ‘Every man lives by exchanging’, said philosopher and economist Adam Smith in the late 18th century. Indeed, trade has historically played a significant role in a country’s economy. In today’s globalised world, trade is a major tool in state policies to ensure economic growth and more jobs. A country’s success in trade generally also leads to better allocation of resources, higher innovation and competitiveness, higher productivity and, consequently, lower prices for both consumers and producers. Trade agreements aimed at facilitating trade and economic relations also deepen cooperation between partners in various other areas, thereby helping to encourage, among other things, the enhancement of social and environmental standards.
EU trade policy, known as the common commercial policy, is the EU’s main external policy. EU trade has flourished, thanks to the establishment of a single market, a single external border and a single trade policy. Currently, the EU is the main global player in trade, responsible for 16.1 % of trade in goods, services, and FDI flows in the world. It is a key partner in world trade in goods, has a leading position in global trade in services, and is also a major source and destination of world investments. The EU has been negotiating trade agreements with third countries since the 1970s. Originally focusing on European, Mediterranean, as well as African, Caribbean and Pacific (ACP) trade partners, the EU now negotiates with partners on every continent. The EU is also a main actor in the multilateral trading system.
See this animated infographic on Trade Flows.
 But what does this mean in practice? What do we know about the share of EU internal versus EU external trade in goods? Which has increased fastest over the past ten years, trade in goods or trade in services? Which Member States trade most between each other? What products does the EU import from the USA and from Canada? Is it common knowledge that EU Member States trade more with other Member States than with countries outside the EU?
Some of these questions have already been answered in the European Parliamentary Research Service (EPRS) publications on EU trade relations with individual countries. This ‘animated infographic‘ serves to complete and cluster this information in a common web-based tool, providing a user-friendly and engaging way to access a full range of information about EU trade.
The infographic illustrates EU trade, firstly from a generic point of view, and secondly in greater detail, considering goods, services and foreign direct investment (FDI). It looks at EU trade both in terms of intra-EU (trade between Member States) and extra-EU (trade between Member States as a whole and the rest of the world). Four sections cover overall trade, intra-EU trade, extra-EU trade, and trade with non-EU partners.
The first section ‘EU trade flows’, includes EU trade data – goods, services and FDI – for the last eleven years (from 2005 onwards), for extra- and intra-EU trade. Each of the subsections includes a graph showing EU trade divided by intra and extra-EU, as well as by import and export.
The second section, ‘Trade between EU Member States’, analyses intra-EU trade in goods. One graph shows the extent to which each Member State trades with other Member States, and with countries outside the EU, including the percentage of intra-EU and extra-EU trade for each Member State. A second graph shows how each Member State trades with the other 27. A map allows the user to choose the Member State in which they are interested, and adapt the two graphs to show data regarding the Member State selected only.
 The third section, ‘EU trade flows with the rest of the world’ is divided in three subsections: trade in goods, services and EU FDI as a whole with the rest of the world. The section begins with a historical graph that shows the development of EU trade from 2005 onwards; a second graph ranks EU trade partners, to show which partners are more important for the EU; it also visualises how the Member States trade with the rest of the world; and which Member States are most important in terms of import and export. Charts at the end of each subsection illustrate the main products, services and activities that the EU imports and exports from/to the rest of the world.
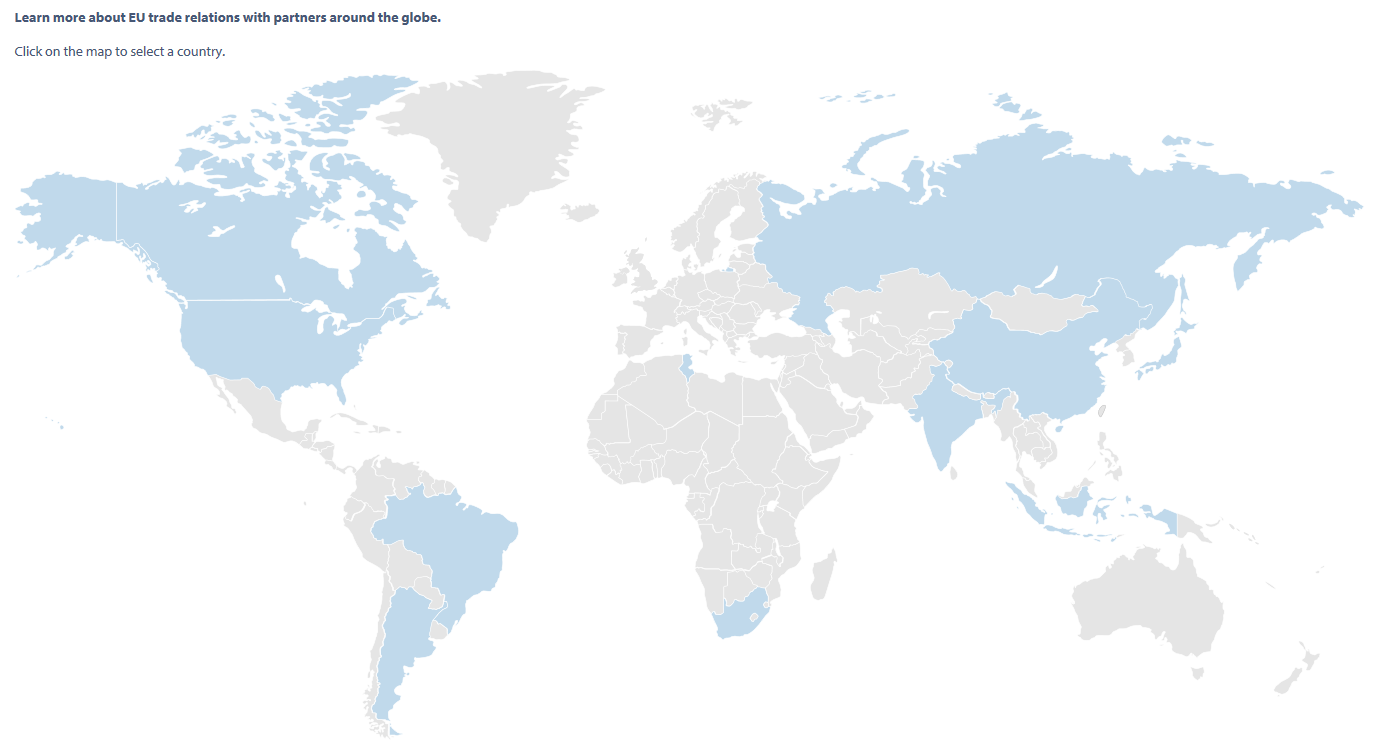
The last section, ‘Trade information between EU and non-EU partner countries’, includes an interactive map that allows the user to select a partner from the following countries: Argentina, Brazil, Canada, China, India, Indonesia, Japan, Russia, South Africa, Tunisia and the USA. This section demonstrates how the EU trades with each country individually; how trade has evolved in the last ten years; which Member States trade the most; and what the EU mainly imports and exports. In addition, to better understand how important the EU is as a trading partner with a selected country, a graph shows each country’s main trade partners. All of this information is available for the three types of trade – goods, services, and FDI.
Navigation from one section to another or within each section to get more detailed information is easy, thanks to interactive maps and to the infographic’s simple layout.
The infographic also includes short overviews of EU trade strategy; the agreements the EU is currently negotiating with third countries; and agreements that have already been concluded; as well as links to EPRS publications.


[…] Source Article from https://epthinktank.eu/2017/06/21/trade-flows-animated-infographic/ […]