Here you’ll find graphs, charts, tables and maps with statistics on culture and education.
To see graphics for other policy areas, go to the Graphics Warehouse.
Graphics on Culture and education
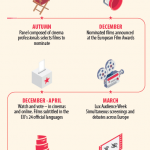
How the audience and MEPs choose the winner
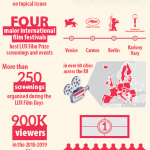
LUX Prize in a nutshell
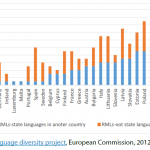
RMLs as state and non-state languages in numbers
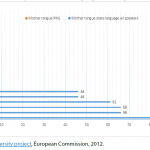
Populations of speakers of state languages and major RMLs in the EU
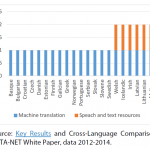
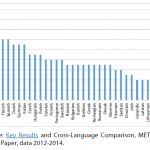
Coverage with machine translation and speech and text resources for European languages
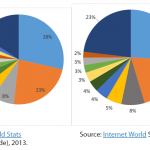
Languages used on the internet by share of internet users in 2013 and 2020
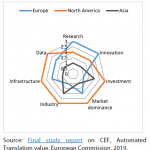
Position of European machine translation market vs North America and Asia
LT coverage of European languages
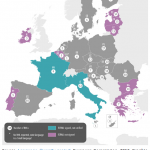
Regional and minority languages in the EU
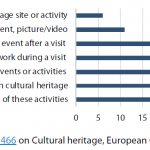
Use of the internet for purposes related to cultural heritage (%)
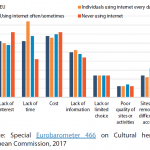
Internet use as a factor in accessing cultural heritage sites
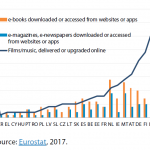
Online purchases of online cultural services as a percentage of individuals who used the internet within the previous year
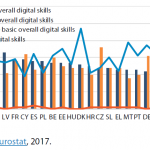
Digital skills (%)
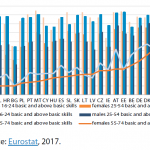
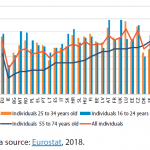
Basic and above-basic digital skills by sex and age (%)
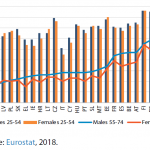
Use of computers or phones to access the internet by sex and age group (%)
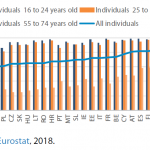
Use of the internet on a mobile phone or smart phone by age group (%)
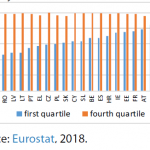
Household access to the internet by revenue (%)
Use of the internet on a desktop computer by age group (%)
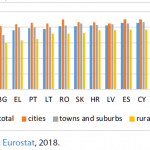
Household internet access by location (%)
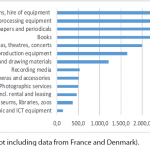
Households’ expenditure on cultural goods and services by consumption purpose (in purchasing power standard)
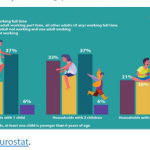
Adults in EU households with young children by working pattern of the adults, 2019
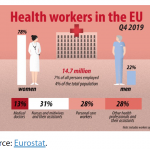
Key data on health workers
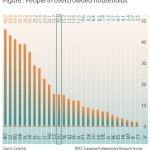
People living in overcrowded households
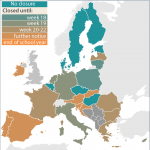
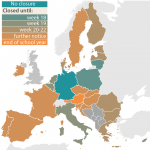
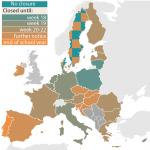
Impact of Covid-19: Closure of early childhood settings
Impact of Covid-19: Closure of higher education institutions
Impact of Covid-19: Closure of schools (ISCED 1-3)
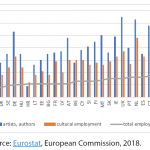
Self-employed in cultural employment and total employment, in %
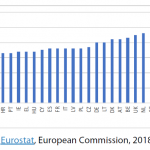
Cultural employment as % of total
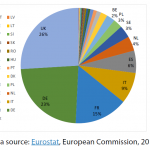
Value-added by Member States’ cultural enterprises, as % of total EU cultural enterprises’ value added
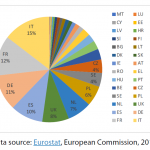
Cultural enterprises in Member
States, as % of total EU cultural enterprises
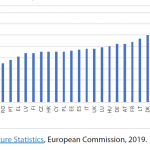
Share of cultural enterprises in all non-financial EU enterprises, 2016, in %
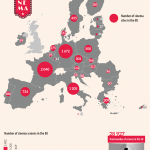
Cinema sites and cinema screens in the EU-27, 2018
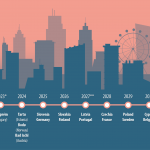
Future Capitals of Culture, 2020-2033
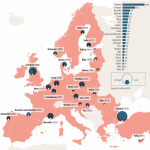
Operational budgets European Capitals of Culture, 2007-2017, € million
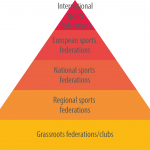
The pyramid structure of sport
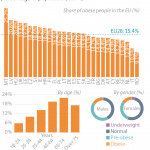
Share of obese people in the EU (%)
(Percentage of population, 2014)
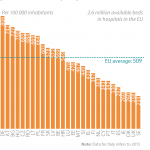
Available beds in hospitals
(Per 100 000 inhabitants, 2016)
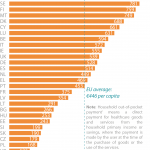
Household out-of-pocket expenditure on healthcare
(Euro per capita, 2016)
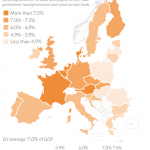
Government expenditure on health
(Percentage of GDP, 2017)
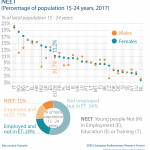
NEET
(Percentage of population 15-24 years, 2017)
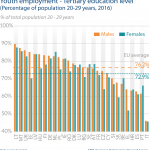
Youth employment – Tertiary education level
(Percentage of population 20-29 years, 2016)
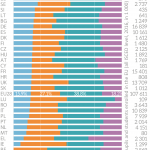
Pupils and students enrolled by education level
(2016)
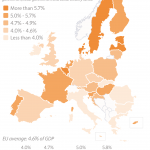
Government expenditure in education
(Percentage of GDP, 2017)
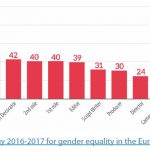
Positions of women in fiction film projects receiving Eurimages funding, 2014-2015
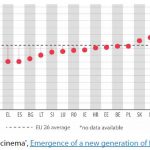
Average percentage of films directed by women in the EU, 2012-2016
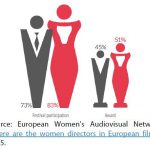
Gender share of overall festival participation and awards
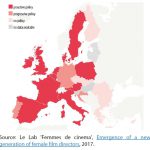
Types of policies pursued in the EU
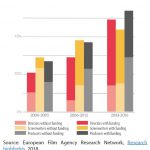
Proportion of fiction films with a woman in a key role, with or without funding from the Swedish Film Institute, 2000-2016
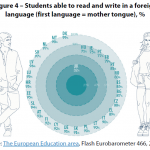
Students able to read and write in a foreign language (first language = mother tongue), %
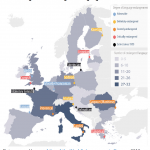
Endangered languages in the EU
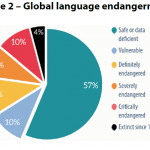
Global language endangerment
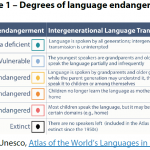
Degrees of language endangerment
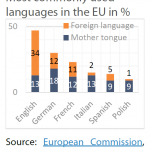
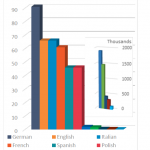
Most commonly used languages in the EU in %
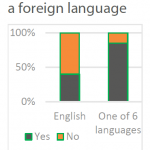
Estimated % of EU population speaking a foreign language
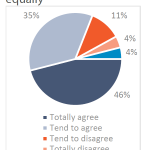
All languages spoken in the EU should be treated equally
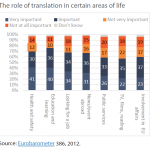
The role of translation in certain areas of life
Population of EU most/least spoken official languages as mother tongues, in millions
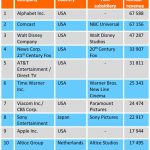
Top 10 media groups worldwide (€ billions, 2015)
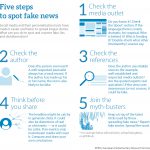
How to spot when news is fake
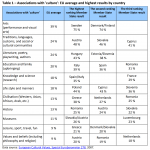
Table 1 – Associations with ‘culture’: EU average and highest results by country
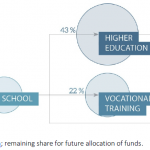
Share of ERASMUS+ funding per education sector
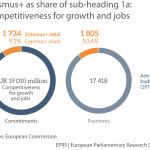
Erasmus+ as share of sub-heading 1a:
Competitiveness for growth and jobs
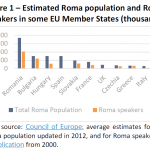
Estimated Roma population and Roma speakers in some EU Member States
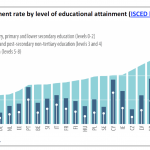
Unemployment rate by level of educational attainment (ISCED levels), 2014 (%)
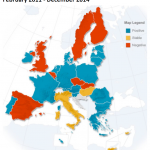
Evolution of organised voluntary activities, February 2011 – December 2014
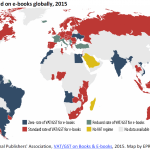
VAT levied on e-books globally, 2015
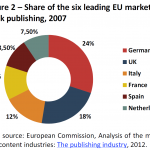
Share of the six leading EU markets in book publishing, 2007
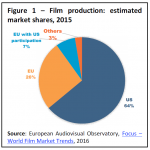
Film production estimated market shares, 2015
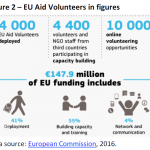
EU Aid Volunteers in figures
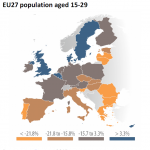
Demographic change 2000-2010, EU27 population aged 15-29
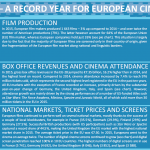
2015 – A record year for European cinema
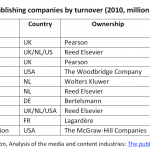
World-leading publishing companies by turnover (2010, million euros)
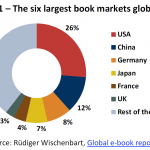
The six largest book markets globally
ERASMUS+ programme
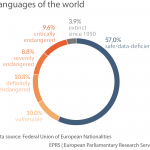
Languages of the world
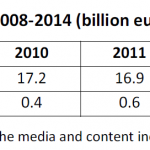
E-book markets in the EU-5, 2008-2014 (billion euros)
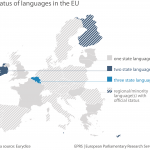
Status of languages in the EU
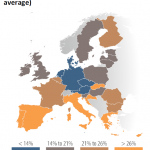
Unemployment rate 2014-2015, EU28 population aged under 25 (annual average)


 / February 18, 2014






Be the first to write a comment.